| Fire incidents reported |
|---|
| Sreet name | Count |
|---|
| HWY 101 | 52 | | BELL ST | 28 | | HWY 101 RD | 16 | | US HWY 101 | 16 | | HARRIS GRADE RD | 6 | | LESLIE ST | 6 | | RURAL LOCATION | 4 | | ALISOS CANYON RD | 4 | | AUGUSTA ST | 4 | | CAT CANYON RD | 4 | | CENTENNIAL ST | 4 | | COINER ST | 4 | | DRUM CANYON RD | 4 | | HWY 101 LOS ALAMOS NB ONRAMP | 4 | | HWY 101 SOUTH BOUND 1 MILE NOR RD | 4 | | HWY 135 | 4 | | MY RD | 4 | | OLD CAREAGA RANCH RD | 4 | | PALMER RD HWY 101 | 4 | | VINTAGE WAY | 4 | | - 0 LOS ALAMOS NB OFFRAMP | 2 | | ALISOS CANYON RD | 2 | | BATCHELDER RD | 2 | | BELL | 2 |
| | | Fire incidents reported |
|---|
| Sreet name | Count |
|---|
| BELL ST | 2 | | BELL ST ST | 2 | | CAT CANYON | 2 | | CENTENNIAL ST ST | 2 | | COINER CT | 2 | | FAIRCHILD LN | 2 | | HELENA ST | 2 | | HELENA ST ST | 2 | | HILL ST | 2 | | HWY 101 LOS ALAMOS NB OFFRAM | 2 | | HWY 101 LOS ALAMOS ON RAMP | 2 | | HWY 101 NORTHBOUND | 2 | | HWY 101 PALMER RD | 2 | | JOSEPH ST | 2 | | LESLIE ST / DEN ST | 2 | | LOS ALAMOS SB OFFRAMP | 2 | | MAIN ST | 2 | | PERKINS ST | 2 | | SHAW ST | 2 | | ST JOSEPH ST LESLIE ST | 2 | | WAITE ST | 2 | | WICKENDEN | 2 | | WICKENDEN ST | 2 | | |
|
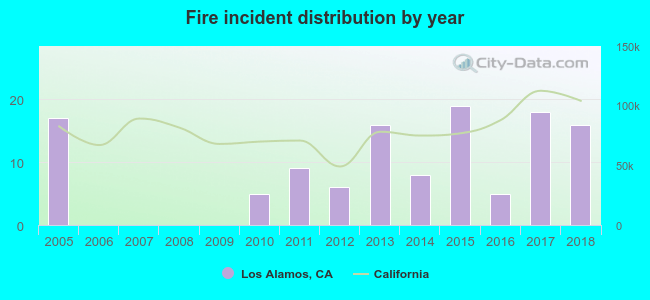 According to the data from the years 2005 - 2018 the average number of fire incidents per year is 9. The highest number of fires - 19 took place in 2015, and the least - 0 in 2006. The data has a decreasing trend.
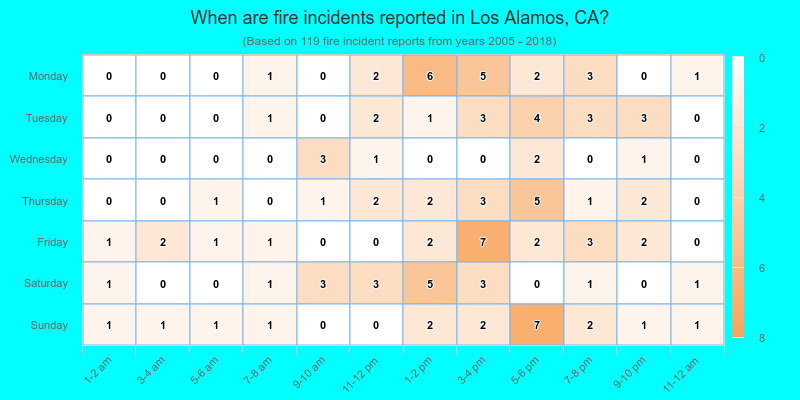
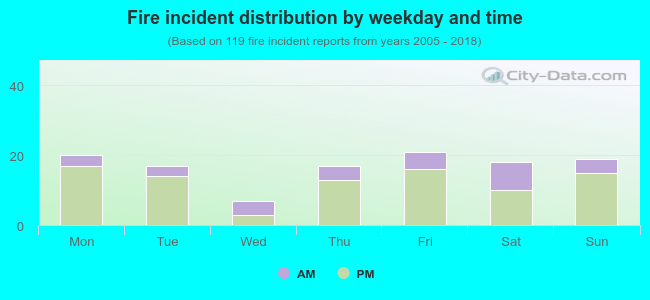 26.1% incidents where reported in the morning and 73.9% in the evening. The most fires (17.6%) took place on Friday, and the least (5.9%) on Wednesday.
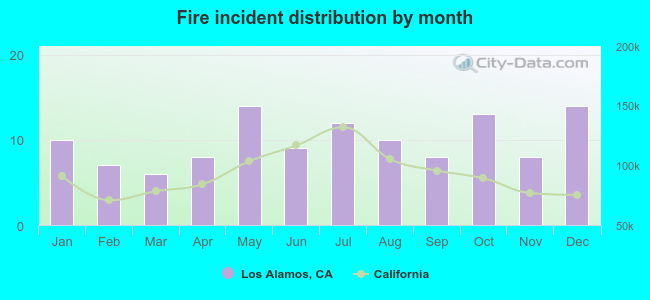 Based on the 119 fire incidents from years 2005 - 2018 most fires (11.8%) took place during May, and the least (5.0%) in March.
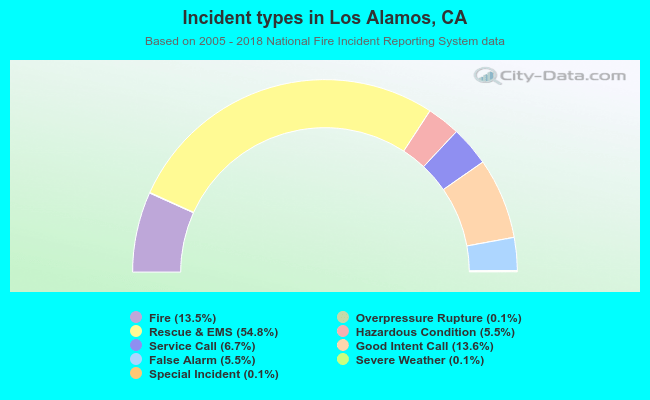 Out of all 883 cases reported during the years 2005 - 2018, the most belonged to the categories: Rescue & EMS (54.8%), Good Intent Call (13.6%), and Fire (13.5%).
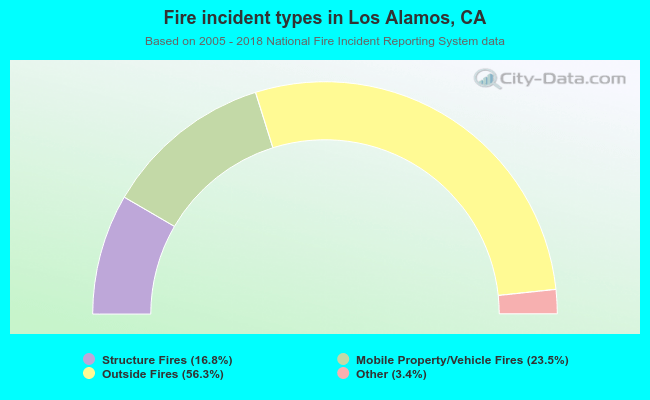 When looking into fire subcategories, the most reports belonged to: Outside Fires (56.3%), and Mobile Property/Vehicle Fires (23.5%).