Lockport: Fire Incidents, Louisiana (LA)
Where are fire incidents reported in Lockport, LA
Something went wrong! Please refresh the page.
|
| |||||||||||||||||||||||||||||||||||||||||||||||||||||||||||||||||||||||||||||||||||||||||||||||||||||||||||||
2002 - 2018 National Fire Incident Reporting System (NFIRS) incidents
- Incident types reported to NFIRS in Lockport, LA
- 27240.6%Rescue & EMS
- 19929.7%Fire
- 10716.0%False Alarm
- 334.9%Hazardous Condition
- 304.5%Good Intent Call
- 243.6%Service Call
- 30.4%Special Incident
- 20.3%Severe Weather
- Fire incident types reported to NFIRS in Lockport, LA
- 9949.7%Outside Fires
- 6834.2%Structure Fires
- 168.0%Mobile Property/Vehicle Fires
- 168.0%Other
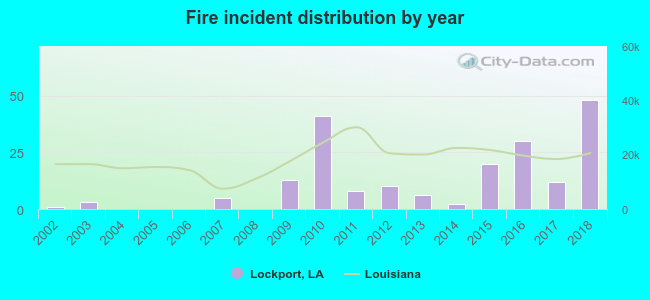 Based on the data from the years 2002 - 2018 the average number of fires per year is 12. The highest number of reported fire incidents - 48 took place in 2018, and the least - 0 in 2004. The data has an increasing trend.
 32.7% incidents where reported in the morning and 67.3% in the evening. The most fires (20.1%) took place on Wednesday, and the least (9.5%) on Tuesday.
 According to the 199 incident reports from years 2002 - 2018 most fires (13.1%) took place during January, and the least (4.0%) in October.
 Out of all 670 cases reported during the years 2002 - 2018, the most belonged to the categories: Overpressure Rupture (40.6%), Fire (29.7%), and Good Intent Call (16.0%).
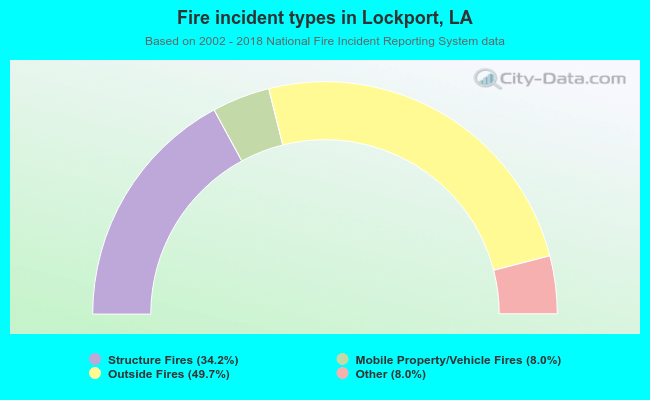 When looking into fire subcategories, the most incidents belonged to: Outside Fires (49.7%), and Structure Fires (34.2%).