Livermore: Fire Incidents, California (CA)
Where are fire incidents reported in Livermore, CA
Something went wrong! Please refresh the page.
| Fire incidents reported | |
|---|---|
| Sreet name | Count |
| I580 | 386 |
| VASCO RD | 164 |
| ALTAMONT PASS RD | 134 |
| 580 | 118 |
| LAS POSITAS RD | 104 |
| FIRST ST | 102 |
| PATTERSON PASS RD | 96 |
| MINES RD | 94 |
| MURRIETA BL | 94 |
| EB I580 | 90 |
| I580 HWY | 82 |
| STANLEY BL | 76 |
| TESLA RD | 72 |
| WB I580 | 60 |
| MIDWAY RD | 54 |
| ALTAMONT PASS RD | 52 |
| ARROYO RD | 50 |
| GREENVILLE RD | 50 |
| N LIVERMORE AV | 50 |
| WALL ST | 50 |
| CORRAL HOLLOW RD | 48 |
| SOUTHFRONT RD | 48 |
| 1ST ST | 46 |
| EAST AVE | 46 |
| FLYNN RD | 46 |
| EB580 | 42 |
| AIRWAY BL | 40 |
| PASEO LAGUNA SECO | 40 |
| TESLA RD | 40 |
| BLUEBELL DR | 38 |
| Other | 1,217 |
2005 - 2018 National Fire Incident Reporting System (NFIRS) incidents
- Incident types reported to NFIRS in Livermore, CA
- 22,39856.5%Rescue & EMS
- 6,59916.7%Good Intent Call
- 3,6299.2%Fire
- 2,4286.1%False Alarm
- 2,4256.1%Service Call
- 2,0645.2%Hazardous Condition
- Fire incident types reported to NFIRS in Livermore, CA
- 1,98054.6%Outside Fires
- 75520.8%Structure Fires
- 75120.7%Mobile Property/Vehicle Fires
- 1433.9%Other
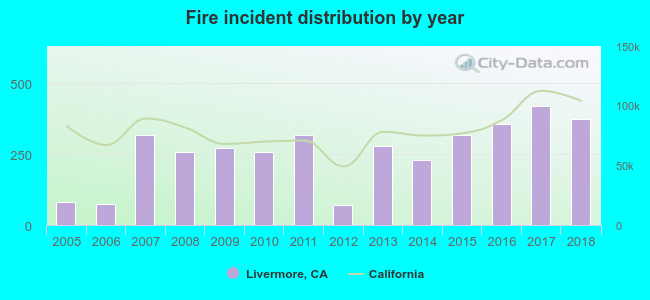 Based on the data from the years 2005 - 2018 the average number of fire incidents per year is 259. The highest number of fire incidents - 421 took place in 2017, and the least - 71 in 2012. The data has a rising trend.
The average number of yearly fire incidents per 10k residents in Livermore, CA compared to nearest cities:
(Note: Based on data for the last 3 years, including only cities with population 5,000 and above)
| Livermore: | 44.1 |
| Pleasanton: | 20.6 |
| Dublin: | 24.0 |
| San Ramon: | 12.6 |
| Blackhawk: | 9.6 |
| Tassajara: | 1.3 |
| Mountain House: | 3.8 |
| Danville: | 11.8 |
| Fremont: | 19.8 |
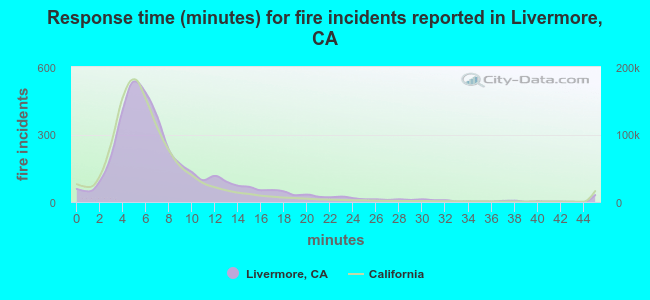 The median response time based on all reported fire incidents is 6 minutes. This is comparable to the state median value.
The median response time in Livermore, CA compared to nearest cities:
(Note: Based on data for all years, including only cities with at least 500 fire incidents)
| Livermore: | 6 minutes |
| Pleasanton: | 5 minutes |
| Dublin: | 5 minutes |
| San Ramon: | 5 minutes |
| Danville: | 6 minutes |
| Fremont: | 5 minutes |
| Union City: | 5 minutes |
| Castro Valley: | 5 minutes |
| Hayward: | 4 minutes |
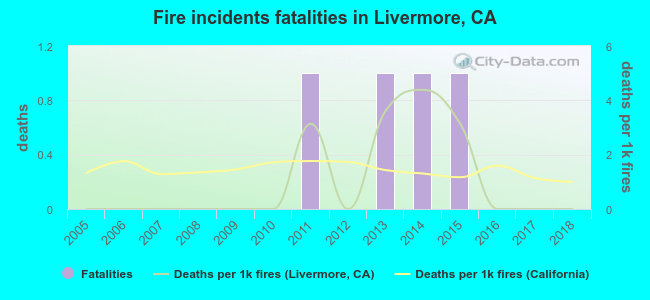 Based on the reports from the years 2005 - 2018 the average number of fire-related fatalities per year is 0. The highest number of deaths - 1 took place in 2011, and the lowest - 0 in 2005. The data has a constant trend.
The average number of fatalities per 1,000 fire incidents is 1. This indicator was the highest - 4 in 2014, and the lowest 0 in 2005. The trend for deaths per 1,000 fire incidents is constant. Compared to the state value the number of fatalities per 1,000 incidents is lower.
Based on the reports from the years 2005 - 2018 the average number of fire-related fatalities per year is 0. The highest number of deaths - 1 took place in 2011, and the lowest - 0 in 2005. The data has a constant trend.
The average number of fatalities per 1,000 fire incidents is 1. This indicator was the highest - 4 in 2014, and the lowest 0 in 2005. The trend for deaths per 1,000 fire incidents is constant. Compared to the state value the number of fatalities per 1,000 incidents is lower.
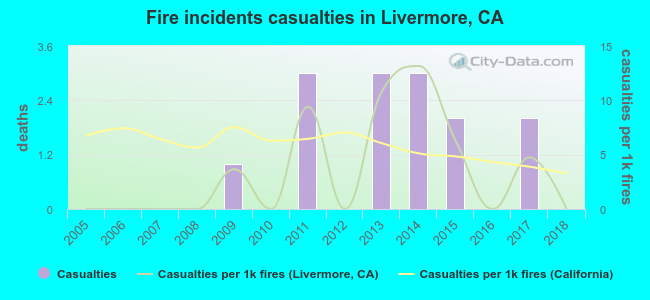 Based on the reports from the years 2005 - 2018 the average number of fire-related casualties per year is 1. The highest number of casualties - 3 took place in 2011, and the lowest - 0 in 2005. The data has a constant trend.
The average number of casualties per 1,000 fires is 3. This indicator was the highest - 13 in 2014, and the lowest 0 in 2005. The trend for injuries per 1,000 fire incidents is constant. Compared to the state value the number of injuries per 1,000 fire incidents is lower.
Based on the reports from the years 2005 - 2018 the average number of fire-related casualties per year is 1. The highest number of casualties - 3 took place in 2011, and the lowest - 0 in 2005. The data has a constant trend.
The average number of casualties per 1,000 fires is 3. This indicator was the highest - 13 in 2014, and the lowest 0 in 2005. The trend for injuries per 1,000 fire incidents is constant. Compared to the state value the number of injuries per 1,000 fire incidents is lower.Casualties per 1,000 incidents in Livermore, CA compared to nearest cities:
(Note: Based on data for all years, including only cities with at least 500 fire incidents)
| Livermore: | 3.9 |
| Pleasanton: | 4.0 |
| Dublin: | 1.9 |
| San Ramon: | 0.0 |
| Danville: | 0.0 |
| Fremont: | 6.6 |
| Union City: | 1.4 |
| Castro Valley: | 0.9 |
| Hayward: | 1.8 |
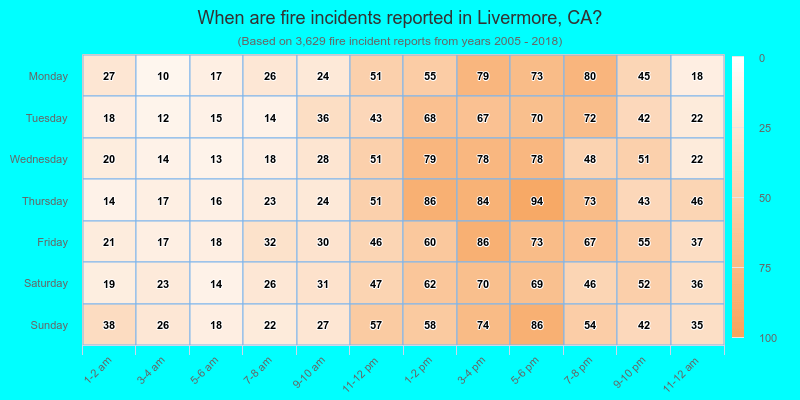
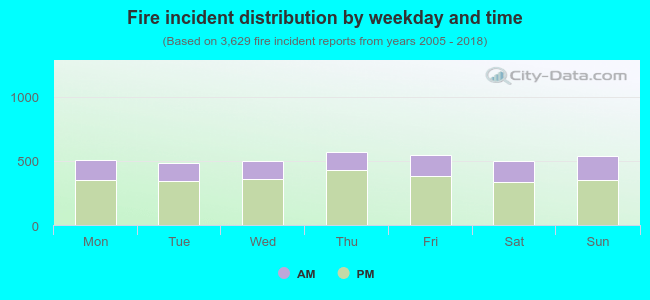 30.1% incidents where reported in the morning and 69.9% in the evening. The most fires (15.7%) took place on Thursday, and the least (13.2%) on Tuesday.
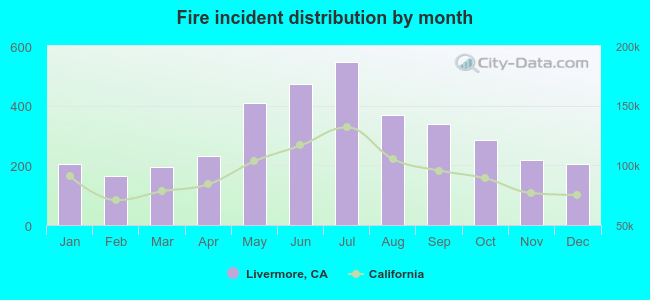 Based on the 3,629 reports from years 2005 - 2018 most fires (15.0%) took place during July, and the least (4.5%) in February.
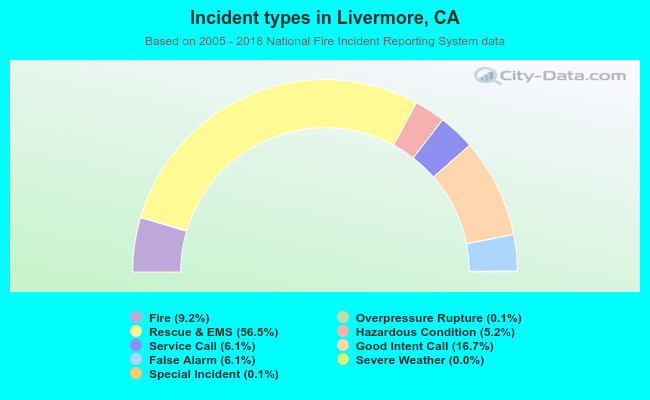 Out of all 39,615 cases reported during the years 2005 - 2018, the most belonged to the categories: Rescue & EMS (56.5%), Good Intent Call (16.7%), and Fire (9.2%).
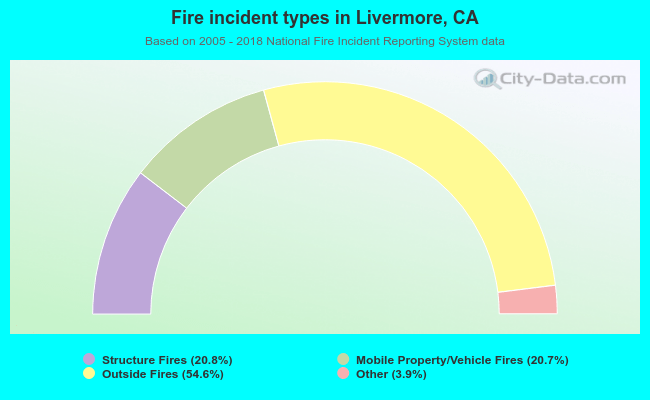 When looking into fire subcategories, the most reports belonged to: Outside Fires (54.6%), and Structure Fires (20.8%).