| Fire incidents reported |
|---|
| Sreet name | Count |
|---|
| BALTIMORE PIKE | 54 | | BOLLINGER ROAD | 24 | | HANOVER PIKE | 22 | | NORTH QUEEN STREET | 20 | | PINE GROVE ROAD | 20 | | FREDERICK PIKE | 14 | | SELL'S STATION ROAD | 14 | | SOUTH QUEEN STREET | 14 | | WHITEHALL ROAD | 14 | | EAST KING STREET | 12 | | BULK PLANT ROAD | 10 | | GETTYSBURG ROAD | 10 | | HARNEY ROAD | 8 | | KINDIG ROAD | 8 | | KING ROAD | 8 | | KRUG ROAD | 8 | | LITTLESTOWN ROAD | 8 | | LUMBER STREET | 8 | | PINE TOWN ROAD | 8 | | WEST KING STREET | 8 | | WEST MYRTLE STREET | 8 | | CALIFORNIA ROAD | 6 | | CHESTNUT HILL ROAD | 6 | | DELAWARE AVENUE | 6 | | LOCUST LANE | 6 |
| | | Fire incidents reported |
|---|
| Sreet name | Count |
|---|
| MEHRING ROAD | 6 | | OLD WESTMINSTER ROAD | 6 | | ORPHANAGE ROAD | 6 | | PLUNKERT ROAD | 6 | | SOUTH COLUMBUS AVENUE | 6 | | SOUTH PARK AVENUE | 6 | | ST. JOHN'S RD. | 6 | | APPLE GROVE LANE | 4 | | BASEHOAR SCHOOL ROAD | 4 | | CHARLES STREET | 4 | | COLORADO AVENUE | 4 | | EAST LAKEVIEW DRIVE | 4 | | FISH AND GAME ROAD | 4 | | GEORGETOWN ROAD | 4 | | HOFFMAN HOME ROAD | 4 | | LEXINGTON WAY | 4 | | M STREET | 4 | | OLD HANOVER RD | 4 | | PINE GROVE RD | 4 | | QUEEN ST | 4 | | SPEELMANKLINGER ROAD | 4 | | 305 MUD COLLEGE RD | 2 | | 4402 BALTIMORE PIKE | 2 | | BABYLON ROAD | 2 | | |
|
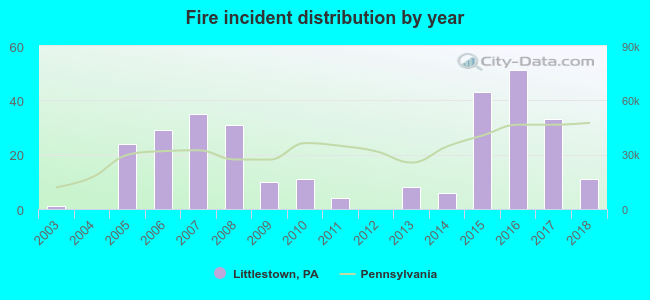 According to the data from the years 2003 - 2018 the average number of fires per year is 19. The highest number of reported fires - 51 took place in 2016, and the least - 0 in 2004. The data has a rising trend.
 30.6% incidents where reported in the morning and 69.4% in the evening. The most fires (16.5%) took place on Saturday, and the least (11.1%) on Tuesday.
 According to the 297 incident reports from years 2003 - 2018 most fires (11.8%) took place during April, and the least (5.4%) in December.
 Out of all 1,079 cases reported during the years 2003 - 2018, the most belonged to the categories: Fire (27.5%), Overpressure Rupture (25.5%), and Service Call (19.2%).
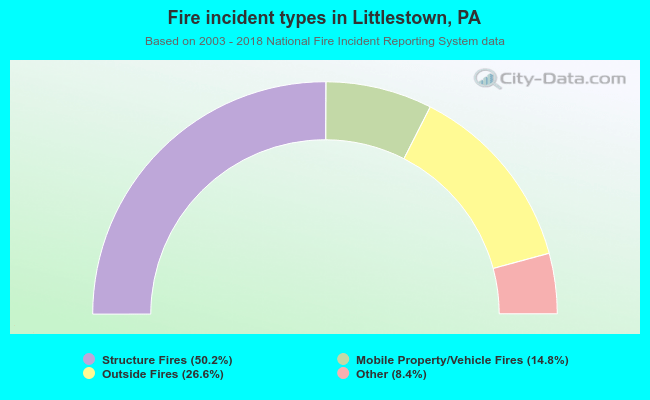 When looking into fire subcategories, the most reports belonged to: Structure Fires (50.2%), and Outside Fires (26.6%).