| Fire incidents reported |
|---|
| Sreet name | Count |
|---|
| MAIN ST | 14 | | WARD ST | 12 | | FINKS BASIN RD | 10 | | CHURCH ST | 8 | | JOHN ST | 8 | | LOOMIS ST | 8 | | NYS RTE 167 | 6 | | SANDY LANE RD | 6 | | BURWELL ST | 4 | | CIRCLE DR | 4 | | DEPOT RD | 4 | | FLINT AVE | 4 | | FORDS BUSH RD | 4 | | INGHAMS MILLS RD | 4 | | NYS THRUWAY | 4 | | PARADISE RD | 4 | | RIVER RD | 4 | | SOUTHERN AVE | 4 | | STATE ROUTE 167 | 4 | | STATE ROUTE 5 | 4 | | STATE ROUTE 5S | 4 | | 3869 STATE RT 167 | 2 | | 556 FIREYHILL RD. | 2 | | 590 PARADISE ROAD | 2 | | 6069 STATE ROUTE 5 | 2 |
| | | Fire incidents reported |
|---|
| Sreet name | Count |
|---|
| 8 WEBSTER ST | 2 | | ALBANY ST | 2 | | ANN STREET LITTLE FALLS FD | 2 | | ARTHUR ST | 2 | | BELLINGER RD | 2 | | BELLINGER ROAD RD | 2 | | BIDELMAN RD | 2 | | BIDLEMAN RD | 2 | | BURCH ST | 2 | | BURRELL RD | 2 | | BURT RD | 2 | | CHURCG ST | 2 | | CREEK AOAD | 2 | | DALE PL | 2 | | DAVIS RD | 2 | | DECKER RD | 2 | | DICE RD | 2 | | DILLENBECK RD | 2 | | DILLENBECK ROAD RD | 2 | | DISE RD | 2 | | E JEFFERSON ST | 2 | | EATONVILLE RD | 2 | | FIERY HILL RD | 2 | | FIERY HILL RD | 2 | | FINCKS BASIN RD | 2 |
|
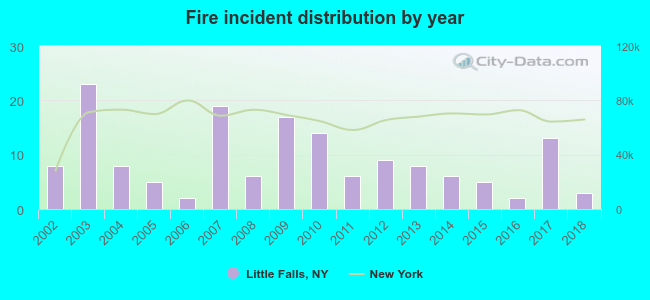 Based on the data from the years 2002 - 2018 the average number of fires per year is 9. The highest number of fires - 23 took place in 2003, and the least - 2 in 2006. The data has a dropping trend.
 42.2% incidents where reported in the morning and 57.8% in the evening. The most fires (20.8%) took place on Monday, and the least (6.5%) on Tuesday.
 Based on the 154 reports from years 2002 - 2018 most fires (19.5%) took place during April, and the least (4.5%) in September.
 Out of all 5,453 cases reported during the years 2002 - 2018, the most belonged to the categories: Rescue & EMS (82.6%), False Alarm (4.7%), and Service Call (4.4%).
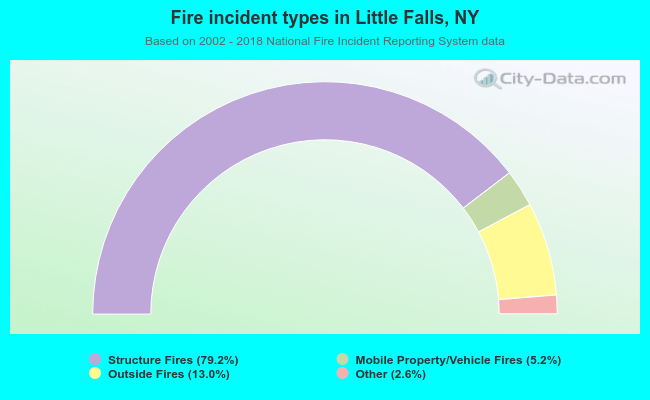 When looking into fire subcategories, the most reports belonged to: Structure Fires (79.2%), and Outside Fires (13.0%).