Little Compton: Fire Incidents, Rhode Island (RI)
Where are fire incidents reported in Little Compton, RI
Something went wrong! Please refresh the page.
|
| |||||||||||||||||||||||||||||||||||||||||||||||||||||||||||||||||||||||||||||||||||||||||||||||||||||||||||||
2008 - 2018 National Fire Incident Reporting System (NFIRS) incidents
- Incident types reported to NFIRS in Little Compton, RI
- 48646.1%Rescue & EMS
- 14313.6%Fire
- 13012.3%Hazardous Condition
- 12311.7%False Alarm
- 959.0%Service Call
- 757.1%Good Intent Call
- 20.2%Special Incident
- Fire incident types reported to NFIRS in Little Compton, RI
- 8458.7%Structure Fires
- 3625.2%Outside Fires
- 139.1%Other
- 107.0%Mobile Property/Vehicle Fires
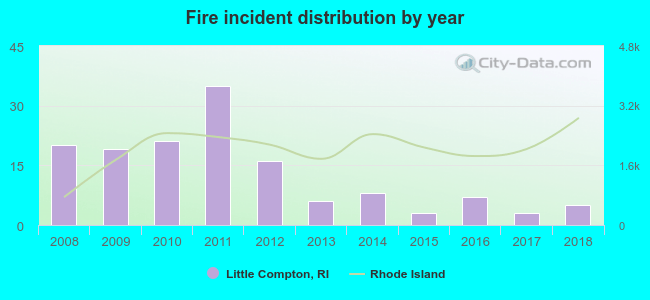 According to the data from the years 2008 - 2018 the average number of fire incidents per year is 13. The highest number of fires - 35 took place in 2011, and the least - 3 in 2015. The data has a dropping trend.
 36.4% incidents where reported in the morning and 63.6% in the evening. The most fires (20.3%) took place on Saturday, and the least (10.5%) on Wednesday.
 According to the 143 fire incidents from years 2008 - 2018 most fires (16.1%) took place during April, and the least (3.5%) in August.
 Out of all 1,055 cases reported during the years 2008 - 2018, the most belonged to the categories: Rescue & EMS (46.1%), Fire (13.6%), and Hazardous Condition (12.3%).
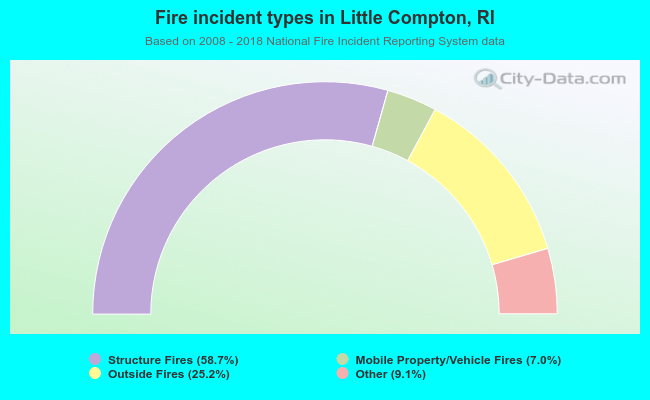 When looking into fire subcategories, the most incidents belonged to: Structure Fires (58.7%), and Outside Fires (25.2%).