| Fire incidents reported |
|---|
| Sreet name | Count |
|---|
| STERLING RD | 12 | | MARSHALL ST | 10 | | 929 ANDERSON RD | 8 | | MOSHERVILLE RD | 8 | | ANDERSON | 6 | | HOMER RD | 6 | | RAINEY RD | 6 | | 10471 GENESEE RD | 4 | | 11891 FRENCH RD | 4 | | 146 N CHICAGO ST | 4 | | 315 SQUIRES DR | 4 | | 8251 W STERLING RD | 4 | | 917 ANDERSON RD | 4 | | ANDERSON RD | 4 | | CRONK RD | 4 | | GARFIELD ST | 4 | | GENESEE RD | 4 | | HERRING RD | 4 | | HOMER RD | 4 | | LITCHFIELD RD | 4 | | MILL ST | 4 | | MOSHERVILLE RD | 4 | | SIMPSON DR | 4 | | 10001 HOMER RD. | 2 | | 10011 HOMER RD. | 2 |
| | | Fire incidents reported |
|---|
| Sreet name | Count |
|---|
| 10100 COOK RD | 2 | | 10191 GENESEE RD | 2 | | 1025 COOK RD. | 2 | | 10275 GENESSE RD | 2 | | 10371 RAINEY RD | 2 | | 1046 GENASEE RD | 2 | | 1046 LITCHFIELD RD | 2 | | 10471 GENNESEE RD. | 2 | | 10760 ANDERSON RD. | 2 | | 10811 COOK RD | 2 | | 10891 CRONK RD | 2 | | 11500 HOMER RD. | 2 | | 116 NICHOLS ST | 2 | | 116 SOUTH CHICAGO ST. | 2 | | 117 CHESTNUT ST | 2 | | 11740 FRENCH RD. | 2 | | 11820 BORDEN RD | 2 | | 11951FRENCH RD | 2 | | 11989 RAINEY RD | 2 | | 1200 EAST LITCHFIELD | 2 | | 123 GARFIELD ST | 2 | | 1235 BIDWELL RD | 2 | | 124 WARRINER AVE | 2 | | 1258 COPLIN RD | 2 | | 126 W. ST JOE ST | 2 |
|
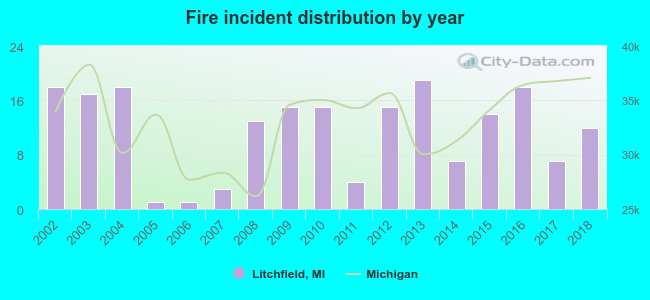 Based on the data from the years 2002 - 2018 the average number of fire incidents per year is 12. The highest number of reported fire incidents - 19 took place in 2013, and the least - 1 in 2005. The data has a declining trend.
 25.9% incidents where reported in the morning and 74.1% in the evening. The most fires (19.8%) took place on Saturday, and the least (10.2%) on Thursday.
 Based on the 197 fire incident reports from years 2002 - 2018 most fires (14.7%) took place during April, and the least (3.0%) in August.
 Out of all 646 cases reported during the years 2002 - 2018, the most belonged to the categories: Fire (30.5%), Hazardous Condition (27.7%), and Rescue & EMS (17.6%).
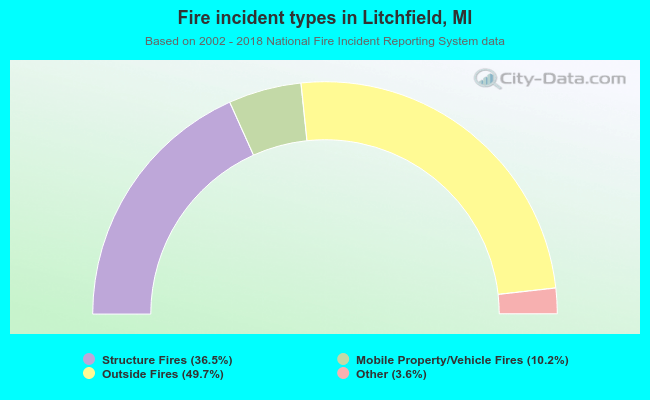 When looking into fire subcategories, the most reports belonged to: Outside Fires (49.7%), and Structure Fires (36.5%).