| Fire incidents reported |
|---|
| Sreet name | Count |
|---|
| LINN VALLEY DR | 18 | | 2400 RD | 12 | | ULLERY RD | 10 | | HOLIDAY DRIVE | 6 | | PECAN DR | 6 | | 39 EAST WOODCUT LANE | 4 | | CAMPFIRE DR | 4 | | OAKCREST DR. | 4 | | PORCUPINE PATH | 4 | | SPRUCE ST | 4 | | WILDERNESS TRL | 4 | | 142 FASCINATION LANE | 2 | | 193 FOOTHILLS TRAIL | 2 | | 2200 RD | 2 | | 2400 RD | 2 | | 2400 ROAD | 2 | | 24999 | 2 | | 2987 SPRUCE DR | 2 | | 34 OHIO DRIVE | 2 | | 359TH ST | 2 | | 39 E WOODCUT DRIVE | 2 | | 69 HWY | 2 | | ASH DR | 2 | | BALD EAGLE DR | 2 | | BEACH CRAFT LN | 2 |
| | | Fire incidents reported |
|---|
| Sreet name | Count |
|---|
| BEECHCRAFT DR | 2 | | BLACK OAK DR | 2 | | BOXELDER ELM | 2 | | BUCKSIN DR | 2 | | BUCKSKIN DR | 2 | | CAMP FIRE DRIVE | 2 | | DOE PATH LN | 2 | | DOEPATH LN | 2 | | ELM DR | 2 | | EXPLORER TR | 2 | | EXPLORER TRAIL | 2 | | FASCINATION LN | 2 | | FAWN VALLEY DR | 2 | | FOOTHILLS TRL | 2 | | GREENWOOD | 2 | | HOLIDAY DR | 2 | | IOWA DR | 2 | | LINN VALLEY BLVD | 2 | | LINN VALLEY BLVD. | 2 | | LINN VALLEY RD | 2 | | LINN WOODS LN | 2 | | MARINA RD | 2 | | MILLS RD | 2 | | MYSTIC VALLET DR | 2 | | |
|
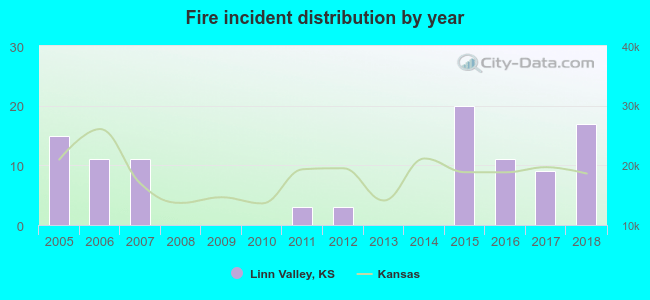 According to the data from the years 2005 - 2018 the average number of fires per year is 7. The highest number of fire incidents - 20 took place in 2015, and the least - 0 in 2008. The data has a growing trend.
 36.0% incidents where reported in the morning and 64.0% in the evening. The most fires (22.0%) took place on Saturday, and the least (9.0%) on Monday.
 Based on the 100 incident reports from years 2005 - 2018 most fires (12.0%) took place during February, and the least (2.0%) in August.
 Out of all 308 cases reported during the years 2005 - 2018, the most belonged to the categories: Overpressure Rupture (54.9%), Fire (32.5%), and Rescue & EMS (4.9%).
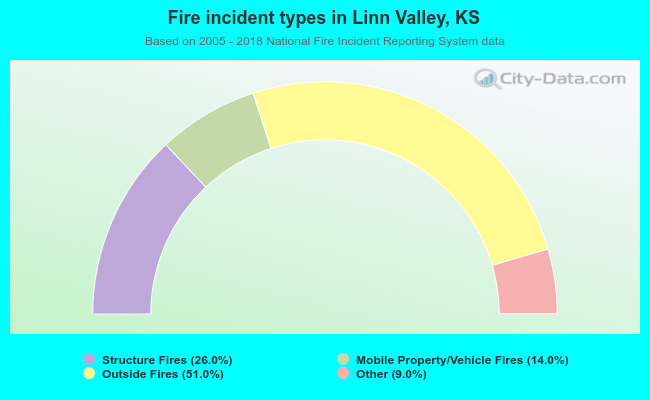 When looking into fire subcategories, the most reports belonged to: Outside Fires (51.0%), and Structure Fires (26.0%).