| Fire incidents reported |
|---|
| Sreet name | Count |
|---|
| OHIO TURNPIKE TPKE | 26 | | CR 106 RD | 14 | | MAIN ST | 14 | | CR 109 RD | 12 | | US ROUTE 20 RT | 12 | | STATE ROUTE 600 HWY | 10 | | STATE ROUTE 53 HWY | 8 | | STATE ROUTE 19 HWY | 6 | | STATE ROUTE 590 HWY | 6 | | C.R. 106 RD | 4 | | CR 704 RD | 4 | | CR 707 RD | 4 | | CR 82 | 4 | | DEWEY ST | 4 | | FANGBONER RD | 4 | | OUT OF AREA | 4 | | STATE ROUTE 523 HWY | 4 | | U. S. ROUTE 20 HWY | 4 | | US ROUTE 20 HWY | 4 | | BRIDGEWATER LANE | 2 | | C. R. 106 RD | 2 | | C.R. 119 RD | 2 | | C.R. 128 RD | 2 | | C.R. 145 RD | 2 | | C.R. 153 RD | 2 |
| | | Fire incidents reported |
|---|
| Sreet name | Count |
|---|
| C.R. 170 RD | 2 | | C.R. 182 RD | 2 | | C.R. 42 RD | 2 | | C.R. 55 RD | 2 | | C.R. 62 | 2 | | C.R. 79 RD | 2 | | C.R. 82 RD | 2 | | C.R. 87 RD | 2 | | CEMETERY ST | 2 | | CR 127 RD | 2 | | CR 128 RD | 2 | | CR 133 RD | 2 | | CR 135 RD | 2 | | CR 147 RD | 2 | | CR 33 | 2 | | CR 702 | 2 | | CR 703 RD | 2 | | CR 704 HESV | 2 | | CR 82 RD | 2 | | CR 87 RD | 2 | | CR-82 | 2 | | EAST BOUND OHIO TURNPIKE TPKE | 2 | | EASTBOUND OHIO TURNPIKE TPKE | 2 | | GARFIELD ST | 2 | | |
|
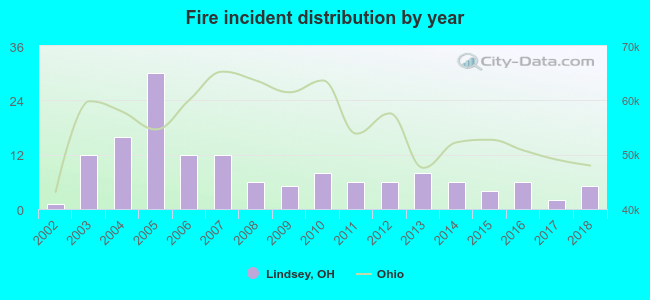 Based on the data from the years 2002 - 2018 the average number of fire incidents per year is 9. The highest number of fire incidents - 30 took place in 2005, and the least - 1 in 2002. The data has an increasing trend.
 22.8% incidents where reported in the morning and 77.2% in the evening. The most fires (17.9%) took place on Friday, and the least (11.0%) on Sunday.
 According to the 145 fire incidents from years 2002 - 2018 most fires (13.8%) took place during April, and the least (3.4%) in December.
 Out of all 484 cases reported during the years 2002 - 2018, the most belonged to the categories: Rescue & EMS (37.6%), Fire (30.0%), and Hazardous Condition (18.8%).
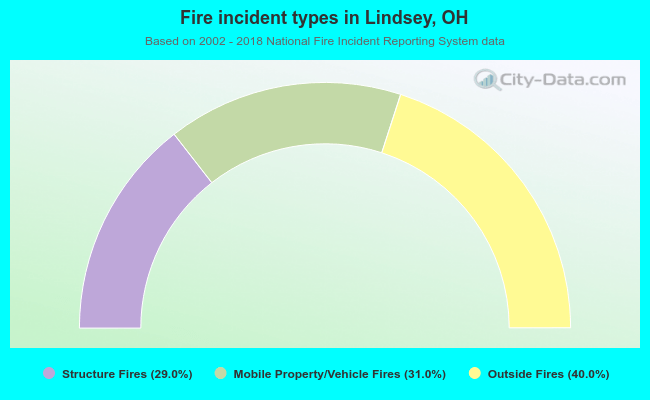 When looking into fire subcategories, the most incidents belonged to: Outside Fires (40.0%), and Mobile Property/Vehicle Fires (31.0%).