Linden: Fire Incidents, California (CA)
Where are fire incidents reported in Linden, CA
Something went wrong! Please refresh the page.
|
| |||||||||||||||||||||||||||||||||||||||||||||||||||||||||||||||||||||||||||||||||||||||||||||||||||||||||||||
2005 - 2018 National Fire Incident Reporting System (NFIRS) incidents
- Incident types reported to NFIRS in Linden, CA
- 78336.0%Rescue & EMS
- 65530.2%Fire
- 26512.2%Good Intent Call
- 2049.4%Hazardous Condition
- 1758.1%Service Call
- 853.9%False Alarm
- 30.1%Severe Weather
- Fire incident types reported to NFIRS in Linden, CA
- 29545.0%Outside Fires
- 23035.1%Mobile Property/Vehicle Fires
- 11818.0%Structure Fires
- 121.8%Other
 Based on the data from the years 2005 - 2018 the average number of fire incidents per year is 47. The highest number of fire incidents - 92 took place in 2006, and the least - 7 in 2012. The data has a declining trend.
 The median response time based on all reported fire incidents is 8 minutes. This is higher compared to the state median value.
The median response time in Linden, CA compared to nearest cities:
(Note: Based on data for all years, including only cities with at least 500 fire incidents)
| Linden: | 8 minutes |
| Stockton: | 5 minutes |
| Lodi: | 5 minutes |
| Manteca: | 5 minutes |
| Lathrop: | 6 minutes |
| Ripon: | 6 minutes |
| Thornton: | 6 minutes |
| Riverbank: | 6 minutes |
| Oakdale: | 6 minutes |
 31.6% incidents where reported in the morning and 68.4% in the evening. The most fires (18.2%) took place on Saturday, and the least (12.2%) on Thursday.
 Based on the 655 reports from years 2005 - 2018 most fires (14.2%) took place during July, and the least (3.4%) in December.
 Out of all 2,172 cases reported during the years 2005 - 2018, the most belonged to the categories: Rescue & EMS (36.0%), Fire (30.2%), and Good Intent Call (12.2%).
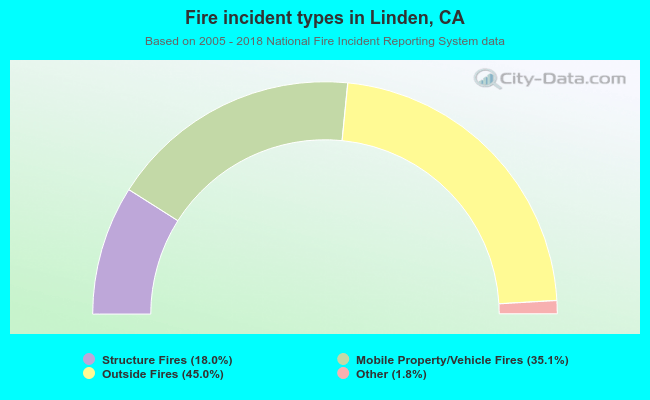 When looking into fire subcategories, the most incidents belonged to: Outside Fires (45.0%), and Mobile Property/Vehicle Fires (35.1%).