Lincoln Heights: Fire Incidents, Ohio (OH)
Where are fire incidents reported in Lincoln Heights, OH
Something went wrong! Please refresh the page.
| Fire incidents reported | |
|---|---|
| Sreet name | Count |
| JACKSON ST | 106 |
| WABASH AVE | 80 |
| ADAMS ST | 70 |
| WAYNE AVE | 60 |
| CONGRESS AVE | 46 |
| SIMMONS AVE | 44 |
| VAN BUREN AVE | 44 |
| BEHLES AVE | 42 |
| WABASH | 42 |
| DANTZLER DR | 40 |
| LEGGETT CT | 40 |
| BYRD AVE | 36 |
| CONGRESS | 34 |
| LINDY AVE | 34 |
| LINDY ST | 34 |
| STEFFENS AVE | 32 |
| LOVE CT | 30 |
| MANGHAM DR | 30 |
| SCHUMARD AVE | 26 |
| THOMAS CT | 26 |
| MATTHEWS DR | 24 |
| CHAMBERLAIN AVE | 22 |
| CHESTER RD | 22 |
| ADAMS AVE | 20 |
| BEHLES ST | 20 |
| DOROTHY CT | 20 |
| MEDOSCH ST | 20 |
| WABASH ST | 20 |
| BYRD ST | 18 |
| JACKSON | 18 |
2002 - 2018 National Fire Incident Reporting System (NFIRS) incidents
- Incident types reported to NFIRS in Lincoln Heights, OH
- 1,33840.8%Rescue & EMS
- 87426.6%Fire
- 45513.9%Good Intent Call
- 39912.2%Hazardous Condition
- 1424.3%False Alarm
- 662.0%Service Call
- 60.2%Special Incident
- Fire incident types reported to NFIRS in Lincoln Heights, OH
- 63672.8%Structure Fires
- 13014.9%Outside Fires
- 10311.8%Mobile Property/Vehicle Fires
- 50.6%Other
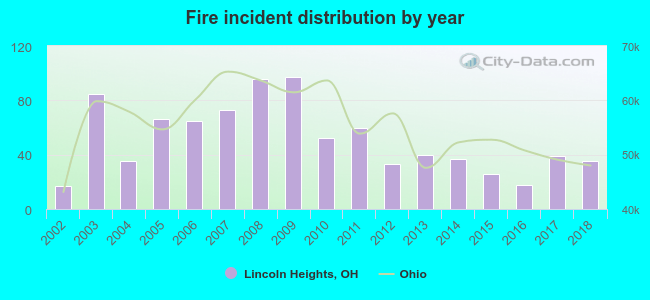 Based on the data from the years 2002 - 2018 the average number of fire incidents per year is 51. The highest number of fire incidents - 97 took place in 2009, and the least - 17 in 2002. The data has an increasing trend.
 The median response time based on all reported fire incidents is 5 minutes. This is lower than the state median value.
The median response time in Lincoln Heights, OH compared to nearest cities:
(Note: Based on data for all years, including only cities with at least 500 fire incidents)
| Lincoln Heights: | 5 minutes |
| Woodlawn: | 5 minutes |
| Lockland: | 6 minutes |
| Evendale: | 5 minutes |
| Wyoming: | 5 minutes |
| Reading: | 5 minutes |
| Springdale: | 5 minutes |
| Sharonville: | 6 minutes |
| Blue Ash: | 5 minutes |
 30.5% incidents where reported in the morning and 69.5% in the evening. The most fires (15.9%) took place on Tuesday, and the least (12.0%) on Monday.
 Based on the 874 incident reports from years 2002 - 2018 most fires (11.3%) took place during December, and the least (5.6%) in October.
 Out of all 3,282 cases reported during the years 2002 - 2018, the most belonged to the categories: Rescue & EMS (40.8%), Fire (26.6%), and Good Intent Call (13.9%).
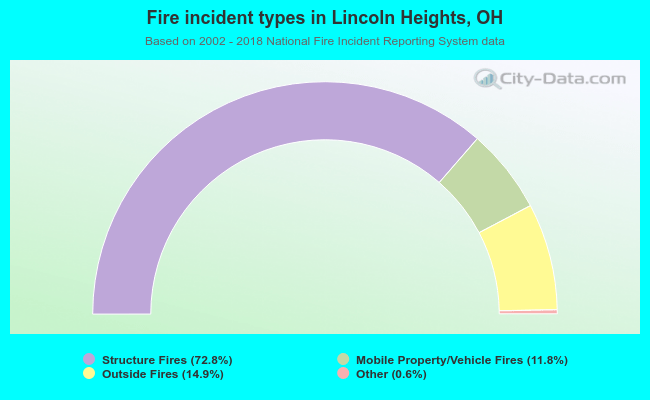 When looking into fire subcategories, the most incidents belonged to: Structure Fires (72.8%), and Outside Fires (14.9%).