Lexington: Fire Incidents, Illinois (IL)
Where are fire incidents reported in Lexington, IL
Something went wrong! Please refresh the page.
|
| |||||||||||||||||||||||||||||||||||||||||||||||||||||||||||||||||||||||||||||||||||||||||||||||||||||||||||||
| Other | 54 | |||||||||||||||||||||||||||||||||||||||||||||||||||||||||||||||||||||||||||||||||||||||||||||||||||||||||||||
2002 - 2018 National Fire Incident Reporting System (NFIRS) incidents
- Incident types reported to NFIRS in Lexington, IL
- 47134.1%Hazardous Condition
- 40629.4%Fire
- 36526.4%Rescue & EMS
- 493.5%Good Intent Call
- 493.5%False Alarm
- 423.0%Service Call
- Fire incident types reported to NFIRS in Lexington, IL
- 18345.1%Outside Fires
- 13733.7%Structure Fires
- 7418.2%Mobile Property/Vehicle Fires
- 123.0%Other
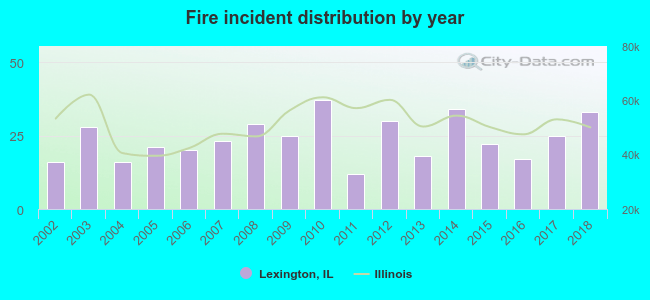 Based on the data from the years 2002 - 2018 the average number of fires per year is 24. The highest number of fire incidents - 37 took place in 2010, and the least - 12 in 2011. The data has an increasing trend.
 29.8% incidents where reported in the morning and 70.2% in the evening. The most fires (18.7%) took place on Monday, and the least (10.8%) on Tuesday.
 According to the 406 incident reports from years 2002 - 2018 most fires (14.3%) took place during April, and the least (2.7%) in January.
 Out of all 1,383 cases reported during the years 2002 - 2018, the most belonged to the categories: Rescue & EMS (34.1%), Fire (29.4%), and Overpressure Rupture (26.4%).
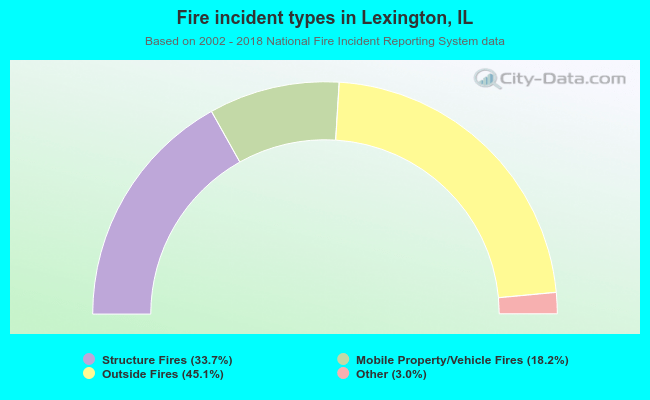 When looking into fire subcategories, the most reports belonged to: Outside Fires (45.1%), and Structure Fires (33.7%).