| Fire incidents reported |
|---|
| Sreet name | Count |
|---|
| SR 379 | 14 | | SR 78 EAST | 10 | | SR 145 | 8 | | SR 145 N | 6 | | STATE ROUTE 145 SOUTH | 6 | | 32150 DEVOE RDG RD TWP 71 | 4 | | 35800 C R 17 | 4 | | 41600 MUSH RUN ROAD | 4 | | BRACKEN RIDGE | 4 | | CHRISTMAN RIDGE | 4 | | DEVOE RIDGE | 4 | | S.R. 145 | 4 | | SR 78 WEST | 4 | | 145 RT | 2 | | 29344 SR 78 | 2 | | 29737 MILTONSBURG CALAIS | 2 | | 29950 CR 79 | 2 | | 30161 S R 78 | 2 | | 30167 BRACKEN RDG | 2 | | 30580 TR244 | 2 | | 31516 CR 33 | 2 | | 31870 TWP RD 70 | 2 | | 31886 CHRISTMAN RIDGE RD. | 2 | | 31900 CR53 | 2 | | 32282 SKIN CREEK ROAD | 2 |
| | | Fire incidents reported |
|---|
| Sreet name | Count |
|---|
| 32555 EDWINA RD. | 2 | | 32800 TR70 | 2 | | 33096 RAILROAD ST | 2 | | 33163 MAIN ST | 2 | | 33765 SR 78 | 2 | | 33830 T H 55 SUMMIT TWP | 2 | | 34008 SKIN CREEK ROAD | 2 | | 34390 BARBER RIDGE RD. | 2 | | 34448 SR 78 | 2 | | 34725 CR 77 | 2 | | 34726 BARBER RIDGE | 2 | | 34733 SR 78 | 2 | | 34799 T R 1030 | 2 | | 35671 TR50 | 2 | | 35671 TWP RD 50 | 2 | | 36112 SR 78 | 2 | | 41175 TWP 289 | 2 | | 42202 TH 660 | 2 | | 43985 CR70 | 2 | | 43985 HANSON RIDGE ROAD | 2 | | 44364 S R 145 | 2 | | 44364 SR 145 | 2 | | 44555 T R 272 | 2 | | 44810 STIMPERT LANE | 2 | | |
|
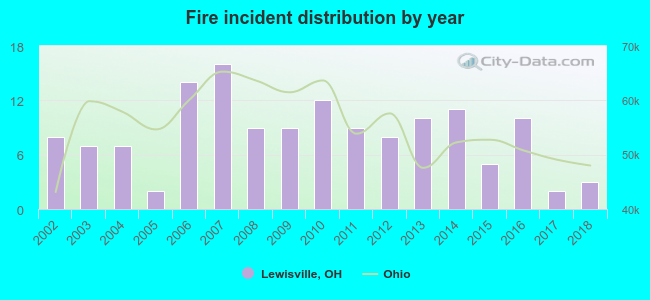 Based on the data from the years 2002 - 2018 the average number of fire incidents per year is 8. The highest number of reported fires - 16 took place in 2007, and the least - 2 in 2005. The data has a decreasing trend.
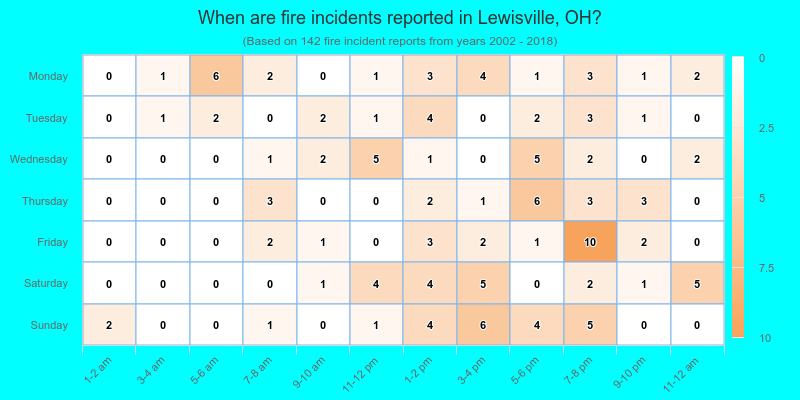
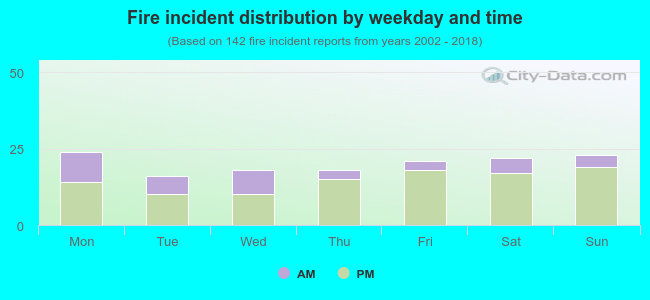 27.5% incidents where reported in the morning and 72.5% in the evening. The most fires (16.9%) took place on Monday, and the least (11.3%) on Tuesday.
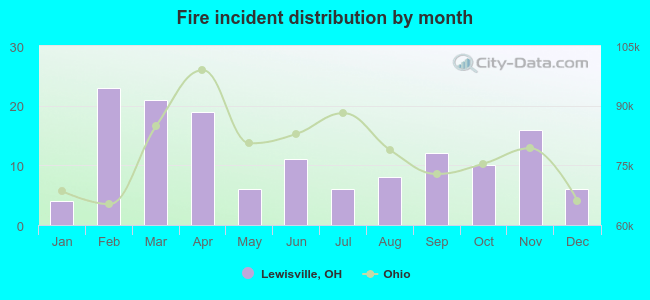 According to the 142 fire incident reports from years 2002 - 2018 most fires (16.2%) took place during February, and the least (2.8%) in January.
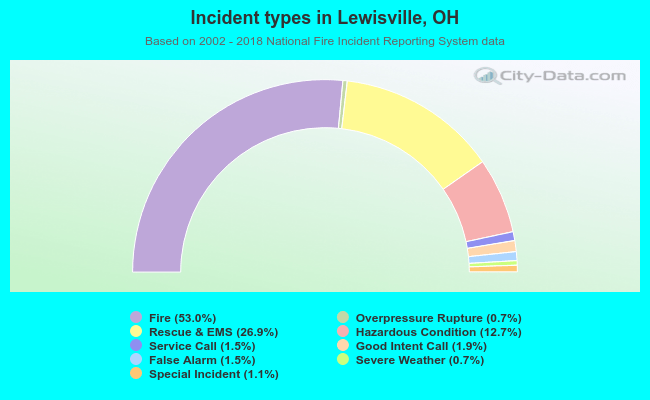 Out of all 268 cases reported during the years 2002 - 2018, the most belonged to the categories: Fire (53.0%), Rescue & EMS (26.9%), and Hazardous Condition (12.7%).
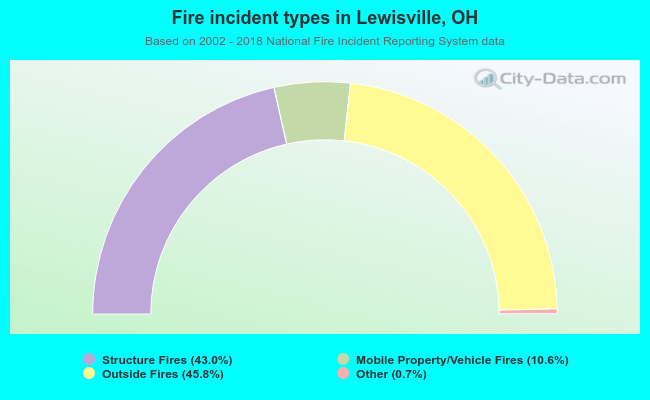 When looking into fire subcategories, the most reports belonged to: Outside Fires (45.8%), and Structure Fires (43.0%).