Lewiston: Fire Incidents, Maine (ME)
Where are fire incidents reported in Lewiston, ME
Something went wrong! Please refresh the page.
| Fire incidents reported | |
|---|---|
| Sreet name | Count |
| LISBON ST | 388 |
| MAIN ST | 308 |
| COLLEGE ST | 198 |
| SABATTUS ST | 194 |
| BARTLETT ST | 160 |
| BLAKE ST | 152 |
| PINE ST | 142 |
| LINCOLN ST | 106 |
| EAST AVE | 90 |
| KNOX ST | 82 |
| RUSSELL ST | 80 |
| BATES ST | 74 |
| PIERCE ST | 74 |
| BIRCH ST | 72 |
| CAMPUS AVE | 72 |
| OAK ST | 72 |
| PARK ST | 72 |
| HORTON ST | 62 |
| HOWE ST | 54 |
| STRAWBERRY AVE | 54 |
| WEBSTER ST | 54 |
| RIDEOUT AVE | 52 |
| TALL PINES DR | 52 |
| WALNUT ST | 50 |
| POND RD | 46 |
| WOOD ST | 44 |
| CANAL ST | 42 |
| MAPLE ST | 42 |
| PLEASANT ST | 42 |
| ASH ST | 38 |
2003 - 2018 National Fire Incident Reporting System (NFIRS) incidents
- Incident types reported to NFIRS in Lewiston, ME
- 3,92031.0%Hazardous Condition
- 2,40219.0%Fire
- 2,16517.1%False Alarm
- 1,83314.5%Rescue & EMS
- 1,1158.8%Service Call
- 1,0938.7%Good Intent Call
- 770.6%Special Incident
- 150.1%Overpressure Rupture
- Fire incident types reported to NFIRS in Lewiston, ME
- 1,38557.7%Structure Fires
- 60725.3%Outside Fires
- 2389.9%Mobile Property/Vehicle Fires
- 1727.2%Other
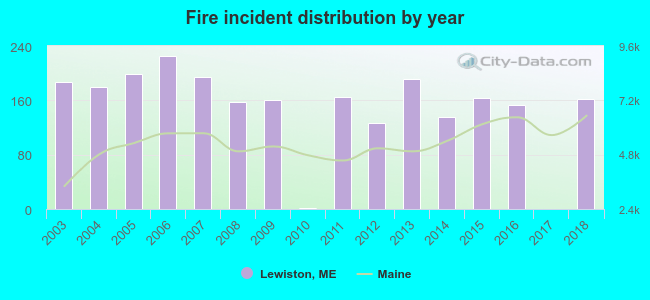 Based on the data from the years 2003 - 2018 the average number of fire incidents per year is 150. The highest number of reported fires - 226 took place in 2006, and the least - 0 in 2017. The data has a decreasing trend.
The average number of yearly fire incidents per 10k residents in Lewiston, ME compared to nearest cities:
(Note: Based on data for the last 3 years, including only cities with population 5,000 and above)
| Lewiston: | 43.4 |
| Auburn: | 50.8 |
| Lisbon: | 33.7 |
| Poland: | 62.0 |
| New Gloucester: | 31.9 |
| Turner: | 50.0 |
| Topsham: | 38.2 |
| Gray: | 54.5 |
| Brunswick: | 68.8 |
 The median response time based on all reported fire incidents is 5 minutes. This is lower than the state median value.
 According to the data from the years 2003 - 2018 the average number of fire-related fatalities per year is 0. The highest number of reported deaths - 2 took place in 2006, and the lowest - 0 in 2003. The data has a constant trend.
 According to the data from the years 2003 - 2018 the average number of fire-related yearly casualties is 2. The highest number of reported casualties - 6 took place in 2005, and the lowest - 0 in 2006. The data has a declining trend.
The average number of casualties per 1,000 fires is 12. This indicator was the highest - 32 in 2008, and the lowest 0 in 2006. The trend for casualties per 1,000 fire incidents is declining. Compared to the Maine value the number of injuries per 1,000 fires is higher.
According to the data from the years 2003 - 2018 the average number of fire-related yearly casualties is 2. The highest number of reported casualties - 6 took place in 2005, and the lowest - 0 in 2006. The data has a declining trend.
The average number of casualties per 1,000 fires is 12. This indicator was the highest - 32 in 2008, and the lowest 0 in 2006. The trend for casualties per 1,000 fire incidents is declining. Compared to the Maine value the number of injuries per 1,000 fires is higher.
 30.0% incidents where reported in the morning and 70.0% in the evening. The most fires (15.7%) took place on Friday, and the least (12.2%) on Thursday.
 Based on the 2,402 fire incident reports from years 2003 - 2018 most fires (11.9%) took place during April, and the least (6.3%) in February.
 Out of all 12,626 cases reported during the years 2003 - 2018, the most belonged to the categories: Hazardous Condition (31.0%), Fire (19.0%), and False Alarm (17.1%).
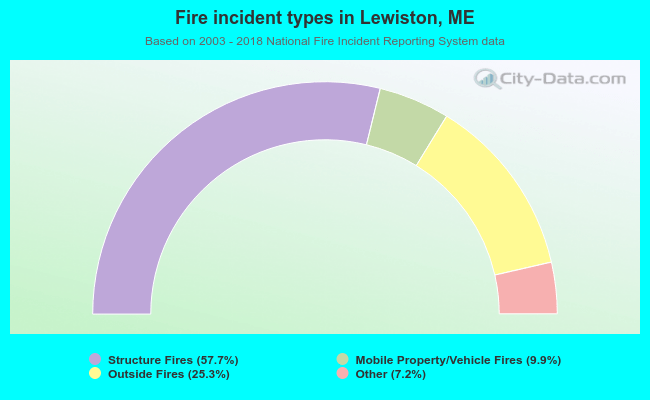 When looking into fire subcategories, the most reports belonged to: Structure Fires (57.7%), and Outside Fires (25.3%).