Lewisburg: Fire Incidents, West Virginia (WV)
Where are fire incidents reported in Lewisburg, WV
Something went wrong! Please refresh the page.
|
| |||||||||||||||||||||||||||||||||||||||||||||||||||||||||||||||||||||||||||||||||||||||||||||||||||||||||||||
| Other | 26 | |||||||||||||||||||||||||||||||||||||||||||||||||||||||||||||||||||||||||||||||||||||||||||||||||||||||||||||
2003 - 2018 National Fire Incident Reporting System (NFIRS) incidents
- Incident types reported to NFIRS in Lewisburg, WV
- 2,03640.6%Rescue & EMS
- 93118.5%Hazardous Condition
- 70814.1%False Alarm
- 4929.8%Fire
- 4769.5%Good Intent Call
- 3707.4%Service Call
- Fire incident types reported to NFIRS in Lewisburg, WV
- 24549.8%Structure Fires
- 12024.4%Outside Fires
- 11723.8%Mobile Property/Vehicle Fires
- 102.0%Other
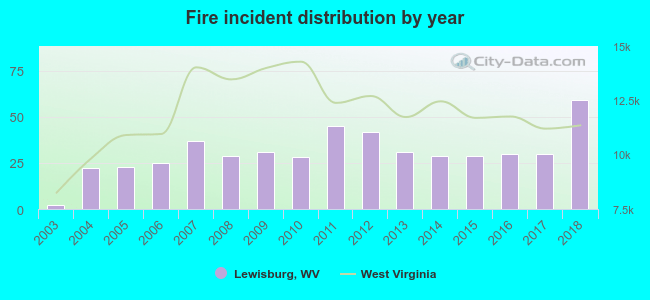 According to the data from the years 2003 - 2018 the average number of fires per year is 31. The highest number of fires - 59 took place in 2018, and the least - 2 in 2003. The data has a growing trend.
 Based on the data from the years 2003 - 2018 the average number of fire-related yearly casualties is 0. The highest number of reported casualties - 1 took place in 2008, and the lowest - 0 in 2003. The data has a rising trend.
 30.9% incidents where reported in the morning and 69.1% in the evening. The most fires (20.1%) took place on Tuesday, and the least (11.8%) on Monday.
 Based on the 492 reports from years 2003 - 2018 most fires (10.6%) took place during March, and the least (7.1%) in August.
 Out of all 5,020 cases reported during the years 2003 - 2018, the most belonged to the categories: Rescue & EMS (40.6%), Hazardous Condition (18.5%), and False Alarm (14.1%).
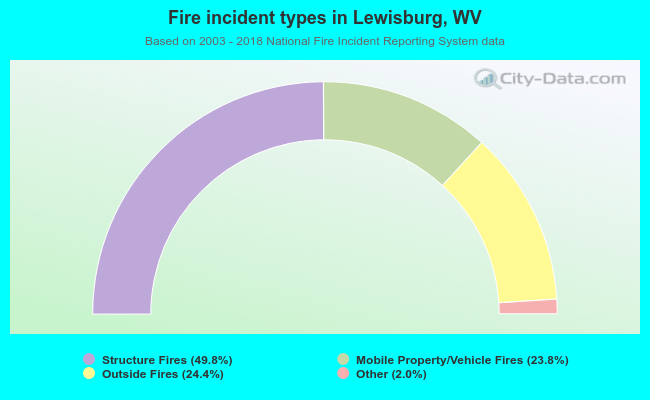 When looking into fire subcategories, the most incidents belonged to: Structure Fires (49.8%), and Outside Fires (24.4%).