Lewisberry: Fire Incidents, Pennsylvania (PA)
Where are fire incidents reported in Lewisberry, PA
Something went wrong! Please refresh the page.
|
| |||||||||||||||||||||||||||||||||||||||||||||||||||||||||||||||||||||||||||||||||||||||||||||||||||||||||||||
2002 - 2018 National Fire Incident Reporting System (NFIRS) incidents
- Incident types reported to NFIRS in Lewisberry, PA
- 38634.0%Fire
- 26523.3%Hazardous Condition
- 18216.0%Good Intent Call
- 18115.9%Rescue & EMS
- 544.8%False Alarm
- 534.7%Service Call
- 100.9%Special Incident
- 30.3%Overpressure Rupture
- 20.2%Severe Weather
- Fire incident types reported to NFIRS in Lewisberry, PA
- 22257.5%Structure Fires
- 8722.5%Outside Fires
- 4110.6%Other
- 369.3%Mobile Property/Vehicle Fires
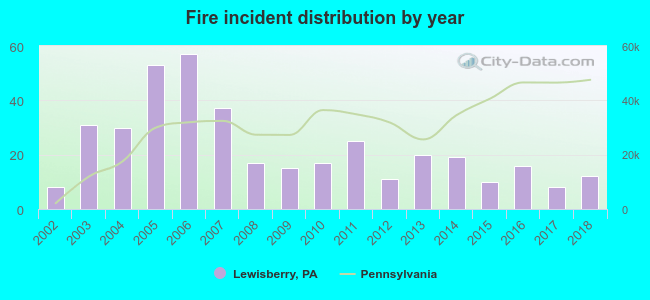 According to the data from the years 2002 - 2018 the average number of fire incidents per year is 23. The highest number of reported fire incidents - 57 took place in 2006, and the least - 8 in 2002. The data has a rising trend.
 40.2% incidents where reported in the morning and 59.8% in the evening. The most fires (17.6%) took place on Saturday, and the least (11.9%) on Thursday.
 Based on the 386 fire incident reports from years 2002 - 2018 most fires (15.5%) took place during February, and the least (4.1%) in November.
 Out of all 1,136 cases reported during the years 2002 - 2018, the most belonged to the categories: Fire (34.0%), Hazardous Condition (23.3%), and Good Intent Call (16.0%).
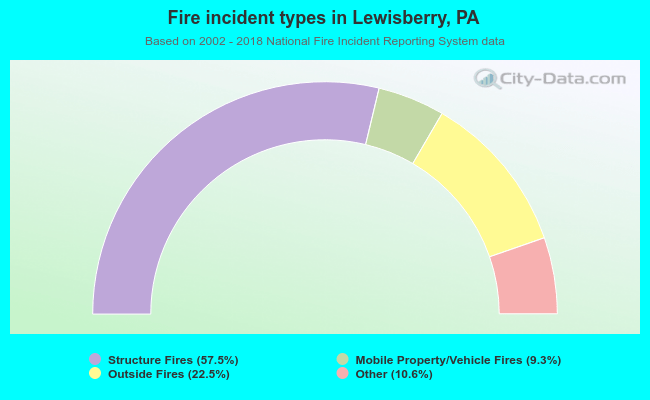 When looking into fire subcategories, the most incidents belonged to: Structure Fires (57.5%), and Outside Fires (22.5%).