Lemoyne: Fire Incidents, Pennsylvania (PA)
Where are fire incidents reported in Lemoyne, PA
Something went wrong! Please refresh the page.
|
| |||||||||||||||||||||||||||||||||||||||||||||||||||||||||||||||||||||||||||||||||||||||||||||||||||||||||||||
2003 - 2018 National Fire Incident Reporting System (NFIRS) incidents
- Incident types reported to NFIRS in Lemoyne, PA
- 36927.5%Fire
- 33625.0%Hazardous Condition
- 23317.3%Rescue & EMS
- 22216.5%Good Intent Call
- 967.1%Service Call
- 775.7%False Alarm
- 70.5%Severe Weather
- 40.3%Special Incident
- Fire incident types reported to NFIRS in Lemoyne, PA
- 22260.2%Structure Fires
- 5916.0%Mobile Property/Vehicle Fires
- 5514.9%Outside Fires
- 338.9%Other
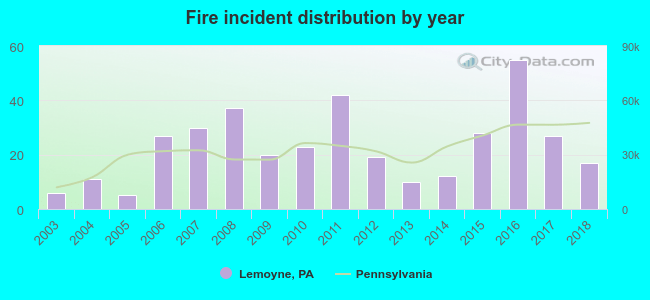 Based on the data from the years 2003 - 2018 the average number of fire incidents per year is 23. The highest number of fires - 55 took place in 2016, and the least - 5 in 2005. The data has an increasing trend.
 37.7% incidents where reported in the morning and 62.3% in the evening. The most fires (16.8%) took place on Saturday, and the least (11.1%) on Thursday.
 According to the 369 fires from years 2003 - 2018 most fires (11.7%) took place during February, and the least (4.9%) in October.
 Out of all 1,344 cases reported during the years 2003 - 2018, the most belonged to the categories: Fire (27.5%), Rescue & EMS (25.0%), and Overpressure Rupture (17.3%).
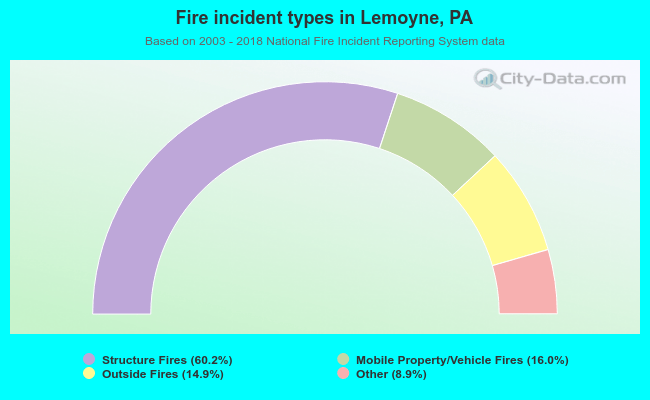 When looking into fire subcategories, the most incidents belonged to: Structure Fires (60.2%), and Mobile Property/Vehicle Fires (16.0%).