| Fire incidents reported |
|---|
| Sreet name | Count |
|---|
| STATE ROUTE 28 RT | 34 | | ST. RTE.771 HWY | 30 | | EASTERN AVE | 26 | | JAMISON RD | 24 | | BARGER RD | 22 | | ST. RTE. 28 HWY | 20 | | EAST MAIN ST | 18 | | MONROE RD | 18 | | BRIDGES RD | 16 | | CAREYTOWN RD | 14 | | CENTERFIELD RD | 14 | | FAIRFIELD ST | 14 | | MAIN ST | 14 | | ST.RTE. 62 HWY | 14 | | CHURCH ST | 12 | | PAUSCH RD | 12 | | STAFFORD RD | 12 | | STATE ROUTE 62 RT | 12 | | HIGH ST | 10 | | SOUTH ST | 10 | | ST RTE. 72 HWY | 10 | | STATE ROUTE 72 | 10 | | THOMAS RD | 10 | | 28 RT | 8 | | BIG OAK RD | 8 |
| | | Fire incidents reported |
|---|
| Sreet name | Count |
|---|
| GRIMSLEY RD | 8 | | LEAVERTON RD | 8 | | RINGER LANE | 8 | | ST. RTE. 62 HWY | 8 | | STATE ROUTE 72 RT | 8 | | UNDERGROUND RD | 8 | | BLACKRABBIT RD | 6 | | BROWN ST | 6 | | BURTON RD | 6 | | MULLEN HILL RD | 6 | | OUT OF DISTRICT RD | 6 | | RINGER LN | 6 | | SABINA RD | 6 | | ANTIOCH RD | 4 | | CHURCH ST | 4 | | COFFEE RD | 4 | | FAIRFIELD RD | 4 | | FISHBACK RD | 4 | | GRAVES LN | 4 | | GROVE ST | 4 | | HARDINS CREEK ROAD | 4 | | HIXSON RD | 4 | | MARKET ST | 4 | | NEW VIENNA RD | 4 | | OLD 62 RT | 4 |
|
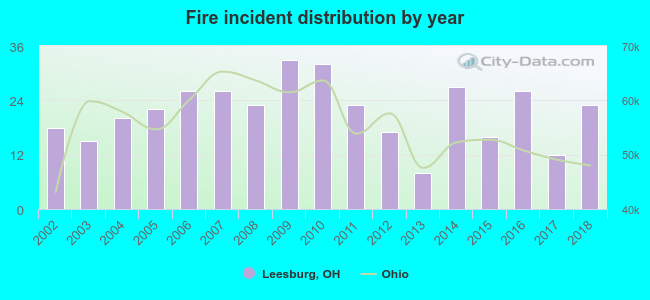 Based on the data from the years 2002 - 2018 the average number of fire incidents per year is 22. The highest number of reported fires - 33 took place in 2009, and the least - 8 in 2013. The data has an increasing trend.
 31.9% incidents where reported in the morning and 68.1% in the evening. The most fires (15.8%) took place on Sunday, and the least (12.5%) on Friday.
 According to the 367 incident reports from years 2002 - 2018 most fires (12.5%) took place during February, and the least (5.7%) in January.
 Out of all 1,265 cases reported during the years 2002 - 2018, the most belonged to the categories: Hazardous Condition (38.6%), Fire (29.0%), and Rescue & EMS (11.2%).
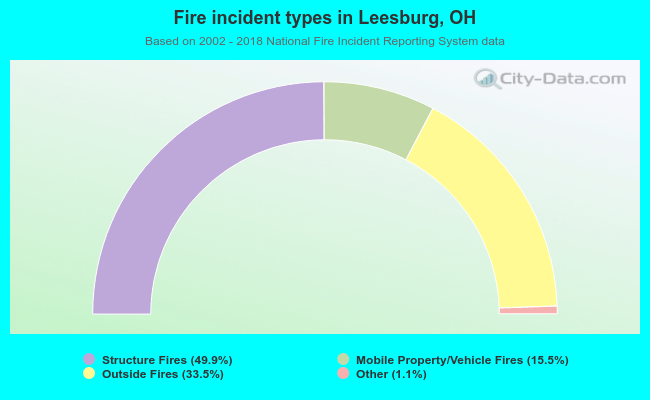 When looking into fire subcategories, the most reports belonged to: Structure Fires (49.9%), and Outside Fires (33.5%).