| Fire incidents reported |
|---|
| Sreet name | Count |
|---|
| SCOTT TROY RD | 18 | | HIGHWAY 50 | 12 | | BROOKFIELD DR | 8 | | INTERSTATE 64 | 8 | | MAIN | 8 | | SCOTT-TROY ROAD | 8 | | 610 N MADISON | 6 | | 701 COLLEGE RD | 6 | | ALBERS RD | 6 | | I64 | 6 | | OAK HILL SCHOOL ROAD | 6 | | 11342 EMERALD MOUND | 4 | | 400 N MONROE | 4 | | 410 SUMMERFIELD ST | 4 | | 416 S HERMAN | 4 | | 600 S HORNER | 4 | | 701 COLLEGE | 4 | | CHARLES TRAIL | 4 | | ENGINE HOUSE 1 | 4 | | HAGEMANN ROAD | 4 | | HAURY RD | 4 | | OFALLON TROY RD | 4 | | RIEDER RD | 4 | | STARR RD | 4 | | WEIL ROAD | 4 |
| | | Fire incidents reported |
|---|
| Sreet name | Count |
|---|
| 100 LOOKING GLASS | 2 | | 10065 RT 4 APT A | 2 | | 101 S CHAMBERLIN | 2 | | 10119 PERRIN RD | 2 | | 10152 RIEDER ROAD | 2 | | 10218 US HWY 50 | 2 | | 104 S CHAMBERLIN | 2 | | 10408 E HWY 50 | 2 | | 10540 PERRIN RD | 2 | | 10735 FOURNIE LANE | 2 | | 11201 RICHWOOD SCHOOL RD | 2 | | 11401 STATE RT 4 | 2 | | 115 W ST LOUIS ST | 2 | | 117 N STANTON | 2 | | 11763 ST ROUTE 4 | 2 | | 11764 EMERALD MOUND RD | 2 | | 1213 COLLEGE | 2 | | 124 E SCHUETZ | 2 | | 124 E SCHUETZ ST | 2 | | 125 E ST LOUIS ST | 2 | | 125 MCALLISTER ST | 2 | | 125 W DEE | 2 | | 127 ROGER DRIVE | 2 | | 143 LYNN ST | 2 | | |
|
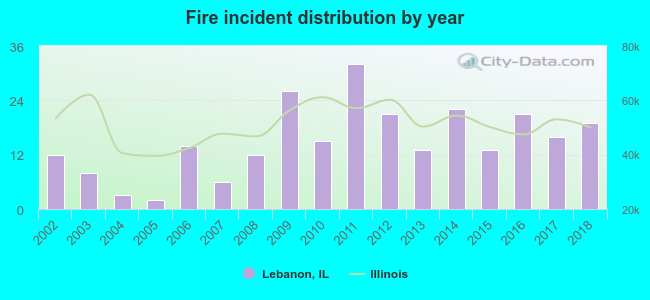 Based on the data from the years 2002 - 2018 the average number of fire incidents per year is 15. The highest number of reported fire incidents - 32 took place in 2011, and the least - 2 in 2005. The data has a rising trend.
 27.5% incidents where reported in the morning and 72.5% in the evening. The most fires (20.4%) took place on Saturday, and the least (12.2%) on Monday.
 According to the 255 fire incident reports from years 2002 - 2018 most fires (12.2%) took place during October, and the least (4.7%) in December.
 Out of all 1,237 cases reported during the years 2002 - 2018, the most belonged to the categories: Hazardous Condition (31.9%), Fire (20.6%), and False Alarm (16.8%).
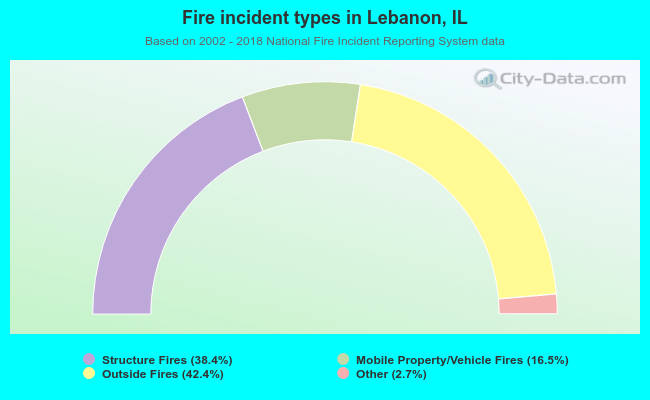 When looking into fire subcategories, the most reports belonged to: Outside Fires (42.4%), and Structure Fires (38.4%).