Laytonsville: Fire Incidents, Maryland (MD)
Where are fire incidents reported in Laytonsville, MD
Something went wrong! Please refresh the page.
|
| |||||||||||||||||||||||||||||||||||||||||||||||||||||||||||||||||||||||||||||||||||||||||||||||||||||||||||||
| Other | 63 | |||||||||||||||||||||||||||||||||||||||||||||||||||||||||||||||||||||||||||||||||||||||||||||||||||||||||||||
2002 - 2018 National Fire Incident Reporting System (NFIRS) incidents
- Incident types reported to NFIRS in Laytonsville, MD
- 26350.7%Hazardous Condition
- 20739.9%Fire
- 193.7%Service Call
- 193.7%Good Intent Call
- 101.9%Rescue & EMS
- 10.2%Special Incident
- Fire incident types reported to NFIRS in Laytonsville, MD
- 10450.2%Outside Fires
- 5928.5%Structure Fires
- 3115.0%Mobile Property/Vehicle Fires
- 136.3%Other
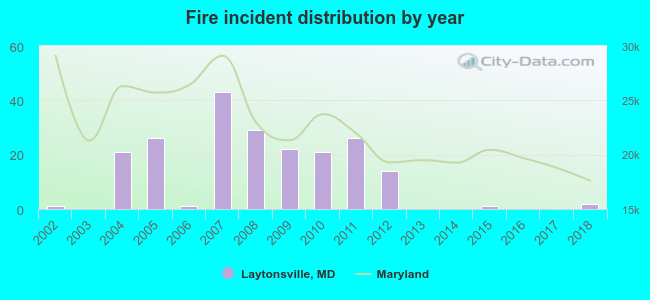 Based on the data from the years 2002 - 2018 the average number of fire incidents per year is 12. The highest number of reported fires - 43 took place in 2007, and the least - 0 in 2003. The data has a rising trend.
 According to the reports from the years 2002 - 2018 the average number of fire-related yearly casualties is 0. The highest number of reported injuries - 2 took place in 2012, and the lowest - 0 in 2002. The data has a constant trend.
 21.7% incidents where reported in the morning and 78.3% in the evening. The most fires (17.9%) took place on Saturday, and the least (11.1%) on Tuesday.
 According to the 207 fire incident reports from years 2002 - 2018 most fires (13.5%) took place during April, and the least (5.3%) in February.
 Out of all 519 cases reported during the years 2002 - 2018, the most belonged to the categories: Rescue & EMS (50.7%), Fire (39.9%), and Hazardous Condition (3.7%).
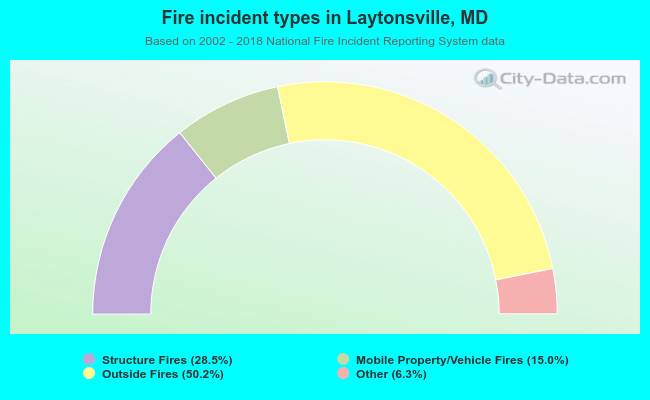 When looking into fire subcategories, the most reports belonged to: Outside Fires (50.2%), and Structure Fires (28.5%).