| Fire incidents reported |
|---|
| Sreet name | Count |
|---|
| WV ROUTE 152 | 40 | | RT. 152 | 32 | | BEECH FORK ROAD | 16 | | BEECH FORK RD | 14 | | BLOSS BRANCH ROAD | 12 | | RT 152 | 12 | | DELTA RD | 10 | | FALLS BRANCH ROAD | 10 | | LYNN CREEK ROAD | 10 | | MOORE ROAD | 10 | | BLOCK 152 | 8 | | DICKSON DAM ROAD | 8 | | MIDVILLE HEIGHTS | 8 | | NEWMAN ROAD | 8 | | PENNINGTON WAY | 8 | | 152 | 6 | | BLOCK BEECH FORK ROAD | 6 | | BOWMAN HILL RD | 6 | | CAMP ROAD | 6 | | DELTA ROAD | 6 | | PENNINGTON WAY | 6 | | RIDGEVIEW DRIVE | 6 | | 5TH STREET RD | 4 | | BEECH FORK RD | 4 | | BLOSS HILL ROAD | 4 |
| | | Fire incidents reported |
|---|
| Sreet name | Count |
|---|
| CAMP CREEK RD | 4 | | DELTA RD | 4 | | DUNKLE BRANCH ROAD | 4 | | ED'S BRANCH | 4 | | GARDEN GATE DRIVE | 4 | | LEFT FORK LYNN CREEK | 4 | | LYNN OAK DRIVE | 4 | | MARION PLYMALE RIDGE | 4 | | PATTY HOLLOW ROAD | 4 | | RIDGEVIEW DR | 4 | | RIVERSIDE DRIVE | 4 | | WV RT 75 | 4 | | WV. RT. 152 | 4 | | 1157 BLOSS BRANCH ROAD | 2 | | 175 MOORE ROAD | 2 | | 193 SMITH STREET | 2 | | 2900 BLK RT-75 HWY | 2 | | 3500 SKYVIEW DRIVE | 2 | | 3765 RT. 75 | 2 | | 3765 RT. 75 LOT B | 2 | | 4366 FOSTER HOLLOW | 2 | | 4399 BOWMAN HILL ROAD | 2 | | 4409 BOWMAN HILL ROAD | 2 | | 4530 RT. 152 | 2 | | 4657 LYNN OAK DRIVE | 2 |
|
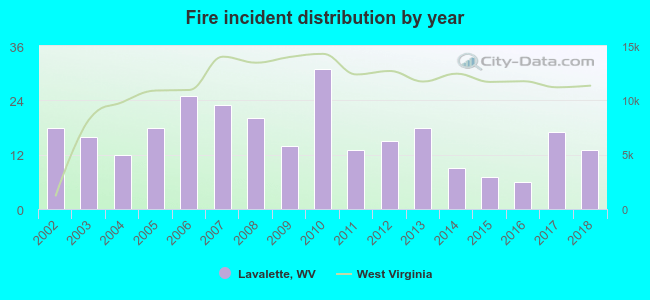 According to the data from the years 2002 - 2018 the average number of fires per year is 16. The highest number of fires - 31 took place in 2010, and the least - 6 in 2016. The data has a dropping trend.
 Based on the data from the years 2002 - 2018 the average number of fire-related yearly casualties is 0. The highest number of reported casualties - 1 took place in 2004, and the lowest - 0 in 2002. The data has a constant trend.
 36.0% incidents where reported in the morning and 64.0% in the evening. The most fires (19.6%) took place on Sunday, and the least (9.5%) on Tuesday.
 According to the 275 fires from years 2002 - 2018 most fires (13.1%) took place during December, and the least (5.1%) in October.
 Out of all 1,174 cases reported during the years 2002 - 2018, the most belonged to the categories: Rescue & EMS (45.9%), Fire (23.4%), and Hazardous Condition (16.6%).
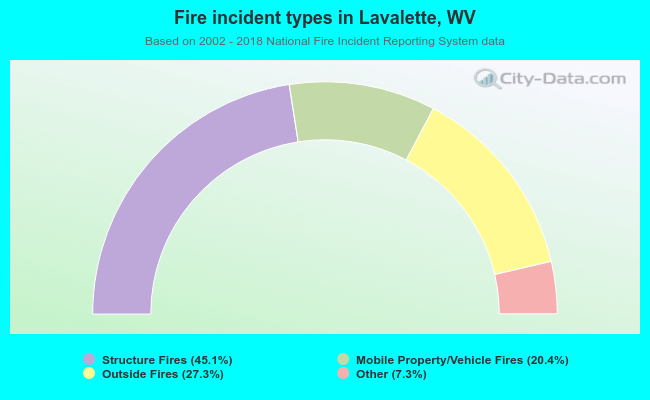 When looking into fire subcategories, the most reports belonged to: Structure Fires (45.1%), and Outside Fires (27.3%).