Laureldale: Fire Incidents, Pennsylvania (PA)
Where are fire incidents reported in Laureldale, PA
Something went wrong! Please refresh the page.
|
| |||||||||||||||||||||||||||||||||||||||||||||||||||||||||||||||||||||||||||||||||||||||||||||||||||||||||||||
2003 - 2018 National Fire Incident Reporting System (NFIRS) incidents
- Incident types reported to NFIRS in Laureldale, PA
- 17135.4%Hazardous Condition
- 16133.3%Fire
- 5912.2%False Alarm
- 5411.2%Good Intent Call
- 224.6%Rescue & EMS
- 122.5%Service Call
- 20.4%Severe Weather
- 20.4%Special Incident
- Fire incident types reported to NFIRS in Laureldale, PA
- 10867.1%Structure Fires
- 2012.4%Mobile Property/Vehicle Fires
- 2012.4%Other
- 138.1%Outside Fires
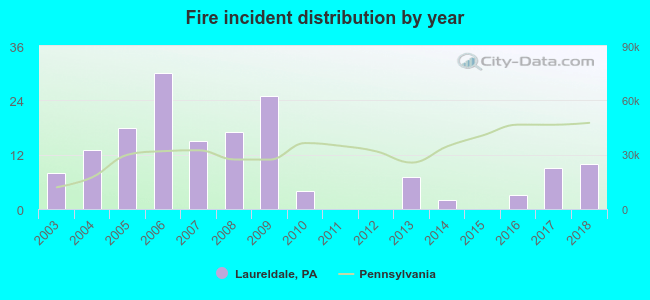 According to the data from the years 2003 - 2018 the average number of fires per year is 10. The highest number of fire incidents - 30 took place in 2006, and the least - 0 in 2011. The data has a rising trend.
 29.8% incidents where reported in the morning and 70.2% in the evening. The most fires (21.7%) took place on Saturday, and the least (9.9%) on Sunday.
 Based on the 161 fire incident reports from years 2003 - 2018 most fires (13.0%) took place during September, and the least (5.0%) in November.
 Out of all 483 cases reported during the years 2003 - 2018, the most belonged to the categories: Rescue & EMS (35.4%), Fire (33.3%), and Good Intent Call (12.2%).
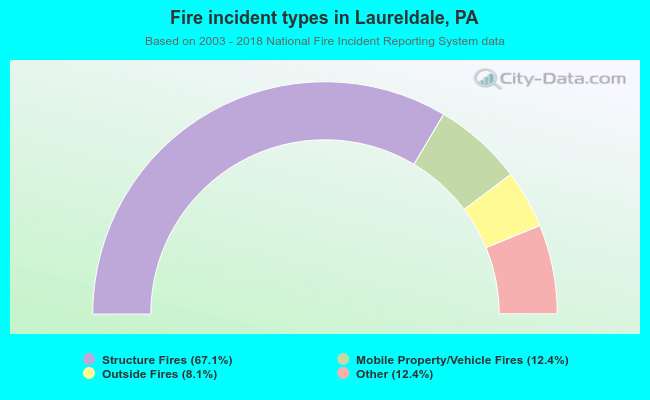 When looking into fire subcategories, the most incidents belonged to: Structure Fires (67.1%), and Mobile Property/Vehicle Fires (12.4%).