| Fire incidents reported |
|---|
| Sreet name | Count |
|---|
| 9950 W 300 S | 8 | | 2389 SOUTH 900 WEST | 6 | | 6670 W 200 N | 6 | | US 30 SR 5 | 6 | | 2123 N BINKLEY RD | 4 | | 2206 NORTH 650 WEST | 4 | | 300 | 4 | | 3640 N SR 5 | 4 | | 4214 W 50 N | 4 | | 5935 W US 30 | 4 | | 6969 W 200S | 4 | | 7824 W 200 N | 4 | | 9982 W 150 S | 4 | | CENTER ST | 4 | | HAMMONTREE ST | 4 | | LINCOLNWAY | 4 | | NOBLE COUNTY | 4 | | SR 5 &750 N | 4 | | U.S. HWY 30 | 4 | | US 30 & BINKLEY RD | 4 | | 0120 N 600 W | 2 | | 0440 N 600 WEST | 2 | | 0680 N 850 WEST | 2 | | 0710 N ST RD 5 | 2 | | 0771 N 425 W | 2 |
| | | Fire incidents reported |
|---|
| Sreet name | Count |
|---|
| 0799 S 375 WEST NOBLE CTY | 2 | | 0870 S 600 W | 2 | | 0969 SOUTH SR 5 | 2 | | 100 | 2 | | 102 E MAIN | 2 | | 1050 S 600 W | 2 | | 1070 N 550 WEST | 2 | | 110E NORTH ST | 2 | | 111 N CENTER STREET | 2 | | 1126 S 425 W | 2 | | 113 W MAIN | 2 | | 1150 W 750 N | 2 | | 1200 S 900 W | 2 | | 1225 NORTH SR 5 | 2 | | 1406 N 400 WEST | 2 | | 1485 N 650 W | 2 | | 150 S 950 W | 2 | | 1655 N. ST.RT. 5 | 2 | | 1724 N 450 W | 2 | | 205 KING ST | 2 | | 208 S CENTER ST | 2 | | 219 S 600 W | 2 | | 226N 950W | 2 | | 250 WEST & 400 NORTH | 2 | | |
|
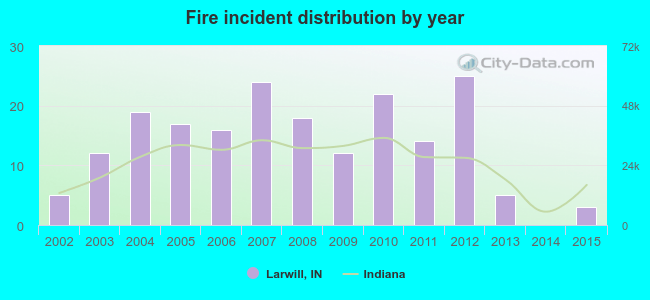 According to the data from the years 2002 - 2015 the average number of fire incidents per year is 14. The highest number of fire incidents - 25 took place in 2012, and the least - 0 in 2014. The data has a declining trend.
 29.7% incidents where reported in the morning and 70.3% in the evening. The most fires (17.2%) took place on Thursday, and the least (10.4%) on Tuesday.
 According to the 192 fire incident reports from years 2002 - 2015 most fires (18.2%) took place during April, and the least (4.2%) in October.
 Out of all 356 cases reported during the years 2002 - 2015, the most belonged to the categories: Fire (53.9%), Overpressure Rupture (23.6%), and Rescue & EMS (13.5%).
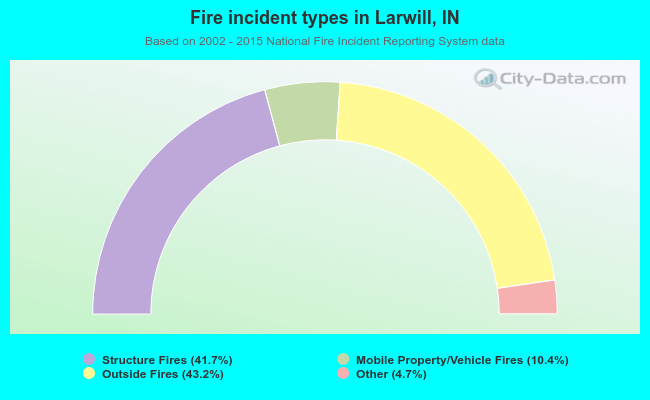 When looking into fire subcategories, the most reports belonged to: Outside Fires (43.2%), and Structure Fires (41.7%).