Laplace: Fire Incidents, Louisiana (LA)
Where are fire incidents reported in Laplace, LA
Something went wrong! Please refresh the page.
| Fire incidents reported | |
|---|---|
| Sreet name | Count |
| AIRLINE HWY | 184 |
| INTERSTATE 10 | 72 |
| I-10 | 52 |
| US 51 HWY | 52 |
| CAMBRIDGE DR | 46 |
| WEST AIRLINE HWY | 42 |
| WILLIAMSBURG DR | 42 |
| W. AIRLINE | 40 |
| I10 EASTBOUND | 38 |
| I10 WESTBOUND | 36 |
| INTERSTATE 55 | 34 |
| MAIN ST | 34 |
| WEST 5TH ST | 32 |
| GREENWOOD DR | 30 |
| WEST AIRLINE | 30 |
| WEST AIRLINE HWY HWY | 30 |
| BELLE TERRE BLVD | 28 |
| CAPT G BOURGEIOS ST | 28 |
| CAMELIA AVE | 24 |
| HIGHWAY 51 | 24 |
| HWY 51 HWY | 24 |
| LA 628 HWY | 24 |
| REVERE DR | 22 |
| U.S. 51 | 22 |
| W. AIRLINE HWY | 22 |
| WHITLOW CT | 22 |
| APRICOT ST | 20 |
| AUGUSTIN LN | 20 |
| FIR ST | 20 |
| I-10 EASTBOUND | 20 |
| Other | 873 |
2002 - 2018 National Fire Incident Reporting System (NFIRS) incidents
- Incident types reported to NFIRS in Laplace, LA
- 2,60633.4%Rescue & EMS
- 1,98725.4%Fire
- 1,08413.9%False Alarm
- 1,06113.6%Hazardous Condition
- 86911.1%Good Intent Call
- 1832.3%Service Call
- 110.1%Severe Weather
- Fire incident types reported to NFIRS in Laplace, LA
- 79640.1%Outside Fires
- 61030.7%Structure Fires
- 52326.3%Mobile Property/Vehicle Fires
- 582.9%Other
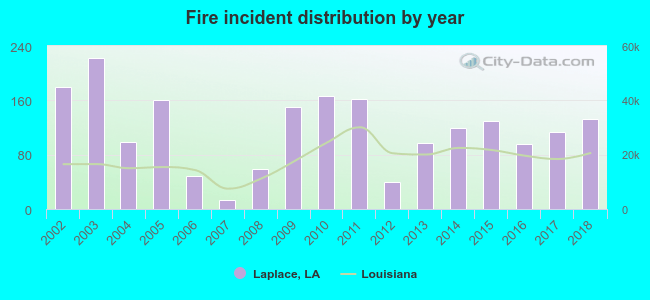 According to the data from the years 2002 - 2018 the average number of fires per year is 117. The highest number of fires - 222 took place in 2003, and the least - 13 in 2007. The data has a decreasing trend.
The average number of yearly fire incidents per 10k residents in Laplace, LA compared to nearest cities:
(Note: Based on data for the last 3 years, including only cities with population 5,000 and above)
| Laplace: | 38.1 |
| Reserve: | 54.6 |
| Destrehan: | 33.5 |
| Luling: | 26.4 |
| Kenner: | 25.8 |
| River Ridge: | 15.3 |
| Waggaman: | 26.3 |
| Metairie: | 15.6 |
| Harahan: | 3.9 |
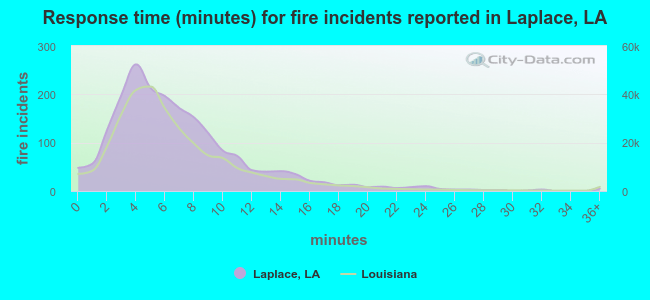 The median response time based on all reported fire incidents is 6 minutes. This is close to the state median value.
The median response time in Laplace, LA compared to nearest cities:
(Note: Based on data for all years, including only cities with at least 500 fire incidents)
| Laplace: | 6 minutes |
| Reserve: | 5 minutes |
| Luling: | 7 minutes |
| Kenner: | 6 minutes |
| Metairie: | 4 minutes |
| Avondale: | 3 minutes |
| Jefferson: | 4 minutes |
| Westwego: | 2 minutes |
| Ponchatoula: | 6 minutes |
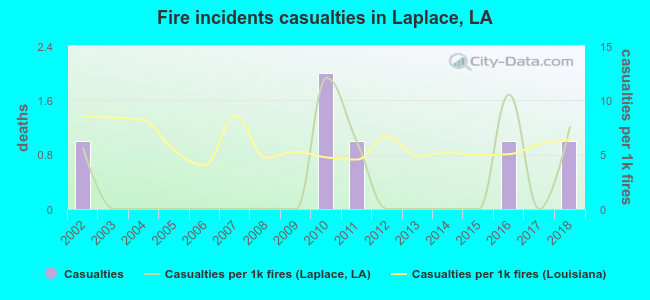 Based on the data from the years 2002 - 2018 the average number of fire-related casualties per year is 0. The highest number of reported injuries - 2 took place in 2010, and the lowest - 0 in 2003. The data has a constant trend.
The average number of injuries per 1,000 fire incidents is 2. This indicator was the highest - 12 in 2010, and the lowest 0 in 2003. The trend for casualties per 1,000 incidents is rising. Compared to the Louisiana value the number of casualties per 1,000 fires is lower.
Based on the data from the years 2002 - 2018 the average number of fire-related casualties per year is 0. The highest number of reported injuries - 2 took place in 2010, and the lowest - 0 in 2003. The data has a constant trend.
The average number of injuries per 1,000 fire incidents is 2. This indicator was the highest - 12 in 2010, and the lowest 0 in 2003. The trend for casualties per 1,000 incidents is rising. Compared to the Louisiana value the number of casualties per 1,000 fires is lower.
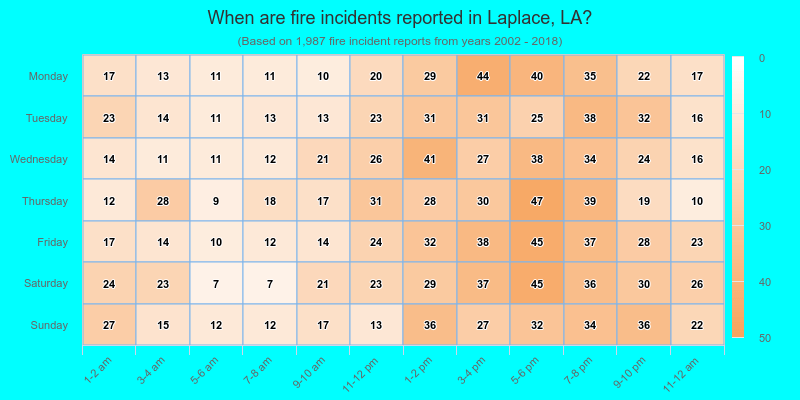
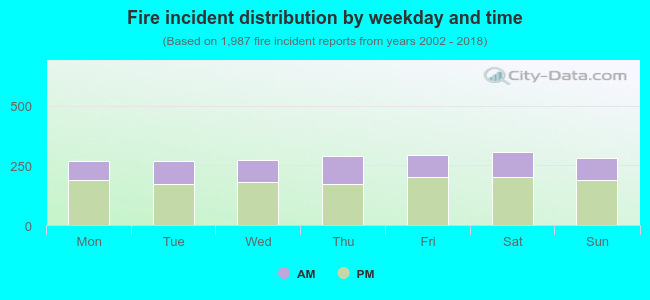 34.3% incidents where reported in the morning and 65.7% in the evening. The most fires (15.5%) took place on Saturday, and the least (13.5%) on Monday.
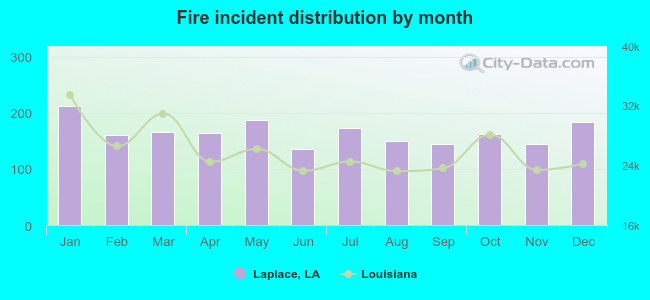 Based on the 1,987 fire incidents from years 2002 - 2018 most fires (10.7%) took place during January, and the least (6.8%) in June.
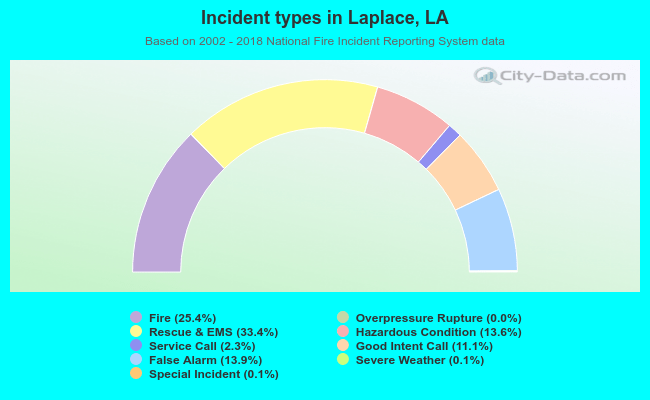 Out of all 7,809 cases reported during the years 2002 - 2018, the most belonged to the categories: Rescue & EMS (33.4%), Fire (25.4%), and False Alarm (13.9%).
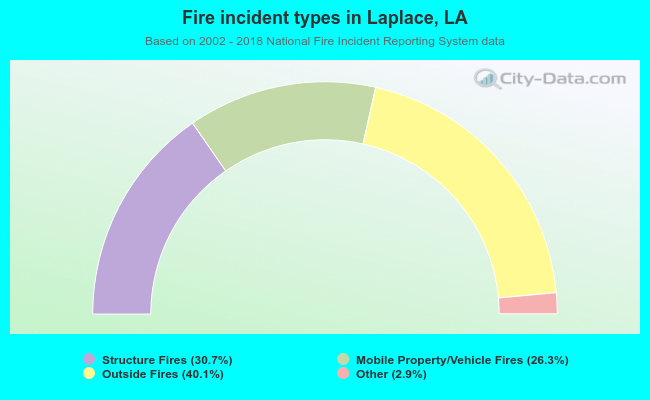 When looking into fire subcategories, the most reports belonged to: Outside Fires (40.1%), and Structure Fires (30.7%).