| Fire incidents reported |
|---|
| Sreet name | Count |
|---|
| LAUREL RUN RD | 38 | | SHEAFFERS VALLEY RD | 22 | | WAGGONERS GAP RD | 20 | | LAUREL RUN ROAD RD | 14 | | MAIN ST | 12 | | SHEAFFERS VALLEY ROAD RD | 12 | | SHERMANS VALLEY RD | 10 | | MILL TOWN RD | 8 | | MILLTOWN ROAD RD | 6 | | MONTOUR RD | 6 | | PISGAH ROAD RD | 6 | | POLE CAT RD | 6 | | REIBERS CHURCH ROAD SPG RD | 6 | | SHEAFFERS VALLEY ROAD | 6 | | WAGONERS GAP ROAD RD | 6 | | WATER STREET | 6 | | EARNEST ROAD 001 400 BLK | 4 | | EAST MAIN STREET | 4 | | FALLEN CABIN LA | 4 | | FALLING CABIN ROAD RD | 4 | | FOX HOLLOW ROAD SPRING RD | 4 | | GREENS VALLEY RD | 4 | | LANDISBURG RD | 4 | | LAURAL RUN RD | 4 | | MCCABE RD | 4 |
| | | Fire incidents reported |
|---|
| Sreet name | Count |
|---|
| MILL ROAD RD | 4 | | MORRISON HIDEAWAY | 4 | | PAIGE HILL RD | 4 | | PAIGE HILL ROAD 1444 BLK | 4 | | PINE HILL ROAD RD | 4 | | ROCK HOLLOW RD | 4 | | SHADY LANE LA | 4 | | BACK HOLLOW RD | 2 | | BAKER | 2 | | BAKER LANE | 2 | | BARTHO DR | 2 | | BELLS HILL ROAD 10001200 | 2 | | BRIDGEPORT RD | 2 | | BRIDGEPORT ROAD RD | 2 | | CARLISLE ST | 2 | | CARLISLE STREET | 2 | | CENTERVILLE RD | 2 | | CORNMAN | 2 | | DANDY | 2 | | DANDY LANE | 2 | | ERNEST RD | 2 | | ERNEST ROAD RD | 2 | | EVERGREEN RD | 2 | | FACULTY AVE | 2 | | |
|
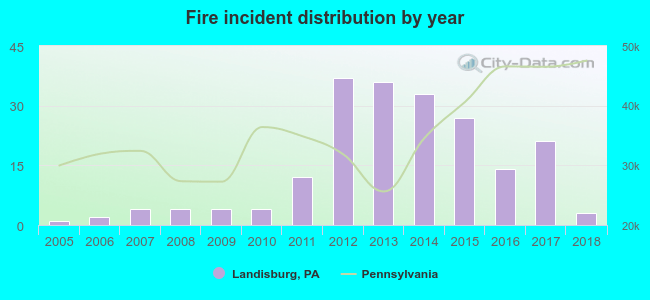 According to the data from the years 2005 - 2018 the average number of fires per year is 14. The highest number of fire incidents - 37 took place in 2012, and the least - 1 in 2005. The data has a growing trend.
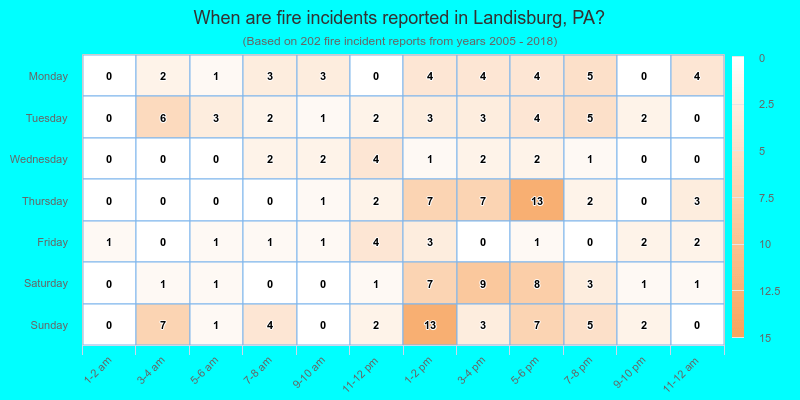
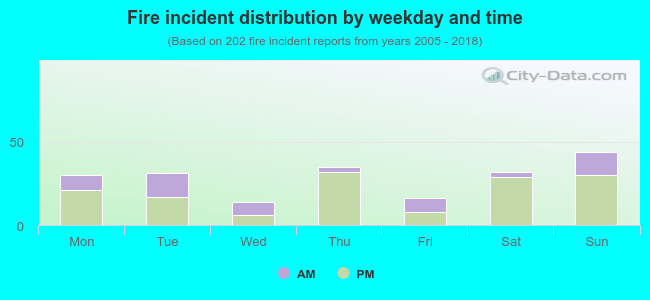 29.2% incidents where reported in the morning and 70.8% in the evening. The most fires (21.8%) took place on Sunday, and the least (6.9%) on Wednesday.
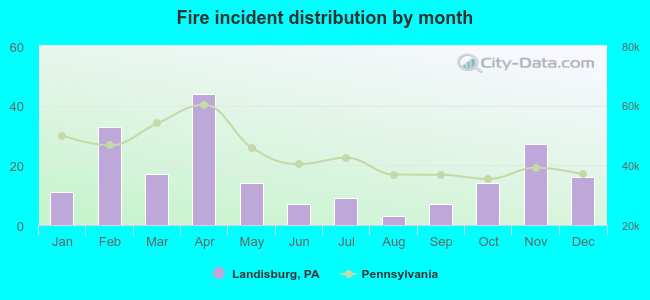 According to the 202 fire incidents from years 2005 - 2018 most fires (21.8%) took place during April, and the least (1.5%) in August.
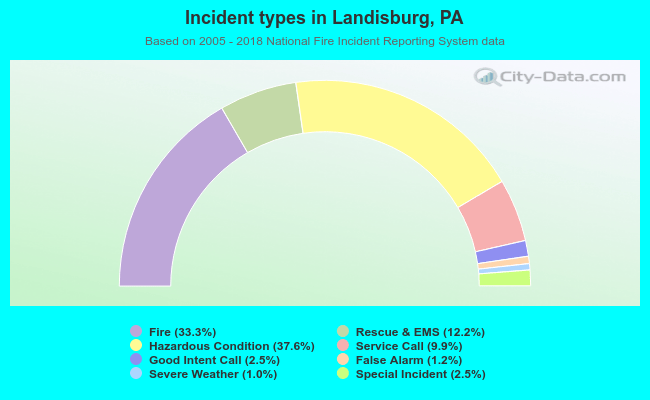 Out of all 607 cases reported during the years 2005 - 2018, the most belonged to the categories: Rescue & EMS (37.6%), Fire (33.3%), and Overpressure Rupture (12.2%).
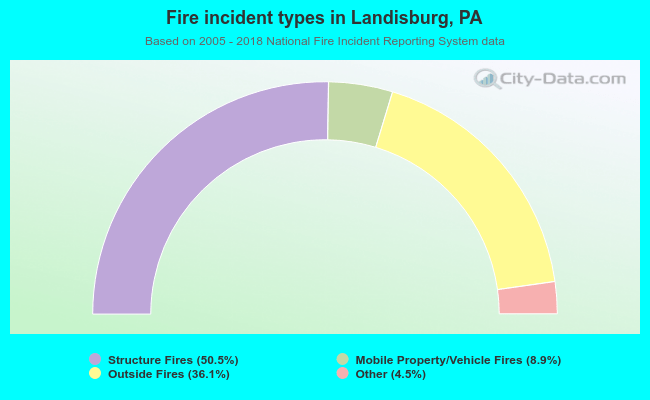 When looking into fire subcategories, the most incidents belonged to: Structure Fires (50.5%), and Outside Fires (36.1%).