Lake Village: Fire Incidents, Arkansas (AR)
Where are fire incidents reported in Lake Village, AR
Something went wrong! Please refresh the page.
|
| |||||||||||||||||||||||||||||||||||||||||||||||||||||||||||||||||||||||||||||||||||||||||||||||||||||||||||||
| Other | 98 | |||||||||||||||||||||||||||||||||||||||||||||||||||||||||||||||||||||||||||||||||||||||||||||||||||||||||||||
2002 - 2018 National Fire Incident Reporting System (NFIRS) incidents
- Incident types reported to NFIRS in Lake Village, AR
- 50278.0%Fire
- 446.8%Rescue & EMS
- 355.4%False Alarm
- 294.5%Hazardous Condition
- 264.0%Good Intent Call
- 60.9%Service Call
- 10.2%Overpressure Rupture
- 10.2%Special Incident
- Fire incident types reported to NFIRS in Lake Village, AR
- 21242.2%Structure Fires
- 18637.1%Outside Fires
- 8717.3%Mobile Property/Vehicle Fires
- 173.4%Other
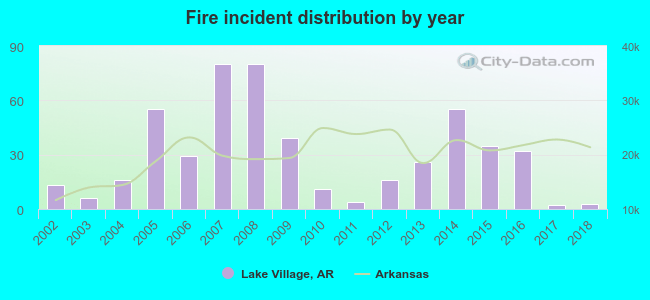 Based on the data from the years 2002 - 2018 the average number of fires per year is 30. The highest number of fire incidents - 80 took place in 2007, and the least - 2 in 2017. The data has a declining trend.
 The median response time based on all reported fire incidents is 8 minutes. This is higher compared to the Arkansas median value.
 36.1% incidents where reported in the morning and 63.9% in the evening. The most fires (17.9%) took place on Sunday, and the least (11.2%) on Friday.
 According to the 502 incident reports from years 2002 - 2018 most fires (12.4%) took place during July, and the least (4.8%) in February.
 Out of all 644 cases reported during the years 2002 - 2018, the most belonged to the categories: Fire (78.0%), Rescue & EMS (6.8%), and False Alarm (5.4%).
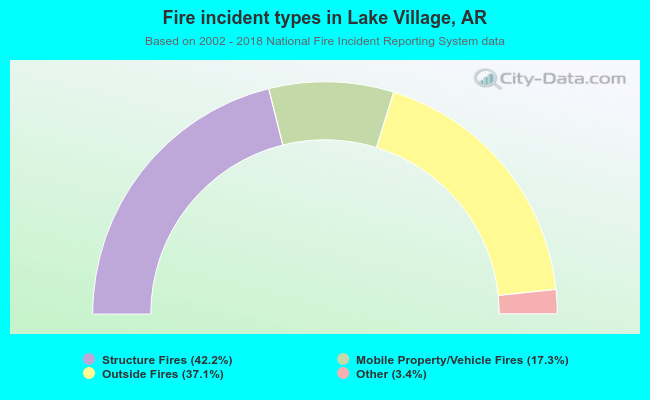 When looking into fire subcategories, the most incidents belonged to: Structure Fires (42.2%), and Outside Fires (37.1%).