Lake Mills: Fire Incidents, Wisconsin (WI)
Where are fire incidents reported in Lake Mills, WI
Something went wrong! Please refresh the page.
|
| |||||||||||||||||||||||||||||||||||||||||||||||||||||||||||||||||||||||||||||||||||||||||||||||||||||||||||||
2003 - 2018 National Fire Incident Reporting System (NFIRS) incidents
- Incident types reported to NFIRS in Lake Mills, WI
- 25429.3%Fire
- 17520.2%Hazardous Condition
- 12414.3%Good Intent Call
- 11012.7%Rescue & EMS
- 10412.0%False Alarm
- 617.0%Service Call
- 374.3%Severe Weather
- 20.2%Special Incident
- 10.1%Overpressure Rupture
- Fire incident types reported to NFIRS in Lake Mills, WI
- 11444.9%Outside Fires
- 10641.7%Structure Fires
- 2911.4%Mobile Property/Vehicle Fires
- 52.0%Other
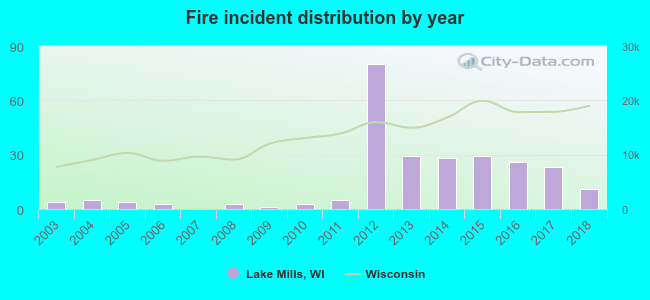 Based on the data from the years 2003 - 2018 the average number of fire incidents per year is 16. The highest number of fires - 80 took place in 2012, and the least - 0 in 2007. The data has an increasing trend.
The average number of yearly fire incidents per 10k residents in Lake Mills, WI compared to nearest cities:
(Note: Based on data for the last 3 years, including only cities with population 5,000 and above)
| Lake Mills: | 34.6 |
| Jefferson: | 38.1 |
| Fort Atkinson: | 33.5 |
| Watertown: | 33.9 |
| Cottage Grove: | 45.0 |
| Sun Prairie: | 21.2 |
| Edgerton: | 45.3 |
| Whitewater: | 38.1 |
| Stoughton: | 46.8 |

 33.1% incidents where reported in the morning and 66.9% in the evening. The most fires (18.9%) took place on Wednesday, and the least (10.6%) on Sunday.
 Based on the 254 incident reports from years 2003 - 2018 most fires (19.3%) took place during November, and the least (3.1%) in June.
 Out of all 868 cases reported during the years 2003 - 2018, the most belonged to the categories: Fire (29.3%), Hazardous Condition (20.2%), and Good Intent Call (14.3%).
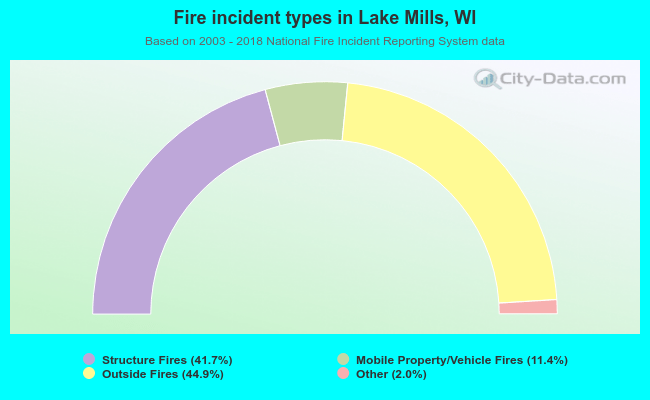 When looking into fire subcategories, the most reports belonged to: Outside Fires (44.9%), and Structure Fires (41.7%).