Laguna Beach: Fire Incidents, California (CA)
Where are fire incidents reported in Laguna Beach, CA
Something went wrong! Please refresh the page.
|
| |||||||||||||||||||||||||||||||||||||||||||||||||||||||||||||||||||||||||||||||||||||||||||||||||||||||||||||
2005 - 2018 National Fire Incident Reporting System (NFIRS) incidents
- Incident types reported to NFIRS in Laguna Beach, CA
- 84240.3%Good Intent Call
- 51824.8%Rescue & EMS
- 31715.2%Hazardous Condition
- 30714.7%Fire
- 572.7%Service Call
- 432.1%False Alarm
- Fire incident types reported to NFIRS in Laguna Beach, CA
- 16654.1%Structure Fires
- 8226.7%Outside Fires
- 3210.4%Mobile Property/Vehicle Fires
- 278.8%Other
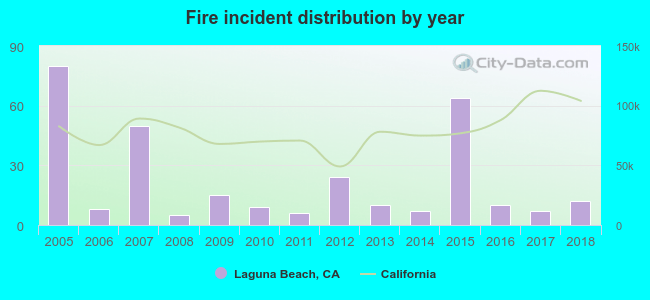 Based on the data from the years 2005 - 2018 the average number of fire incidents per year is 22. The highest number of fire incidents - 80 took place in 2005, and the least - 5 in 2008. The data has a declining trend.
The average number of yearly fire incidents per 10k residents in Laguna Beach, CA compared to nearest cities:
(Note: Based on data for the last 3 years, including only cities with population 5,000 and above)
| Laguna Beach: | 4.1 |
| Laguna Niguel: | 7.1 |
| Aliso Viejo: | 6.9 |
| South Coast: | 0.4 |
| Laguna Woods: | 12.8 |
| Dana Point: | 10.7 |
| Laguna Hills: | 15.7 |
| San Juan Capistrano: | 12.5 |
| Ladera Ranch: | 1.1 |
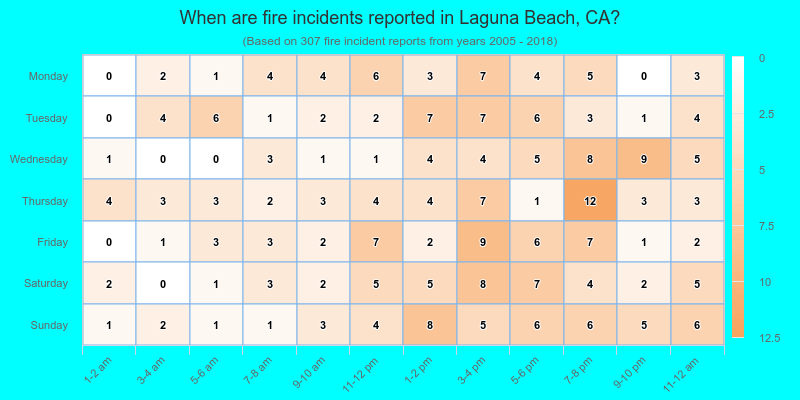
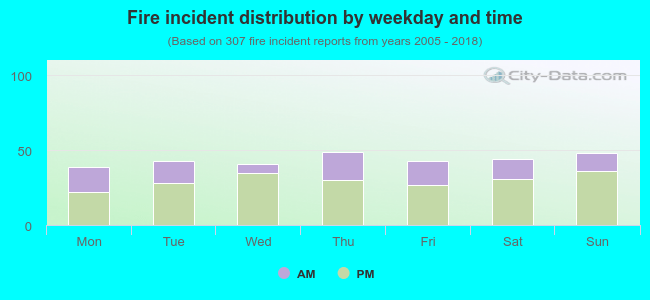 31.9% incidents where reported in the morning and 68.1% in the evening. The most fires (16.0%) took place on Thursday, and the least (12.7%) on Monday.
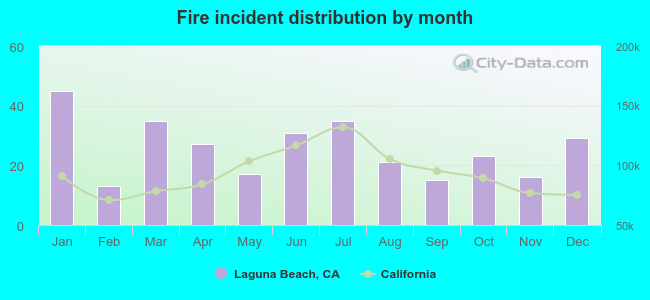 According to the 307 incident reports from years 2005 - 2018 most fires (14.7%) took place during January, and the least (4.2%) in February.
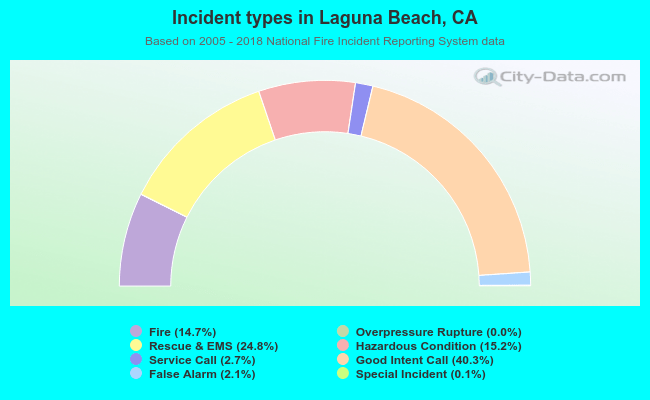 Out of all 2,087 cases reported during the years 2005 - 2018, the most belonged to the categories: Good Intent Call (40.3%), Rescue & EMS (24.8%), and Hazardous Condition (15.2%).
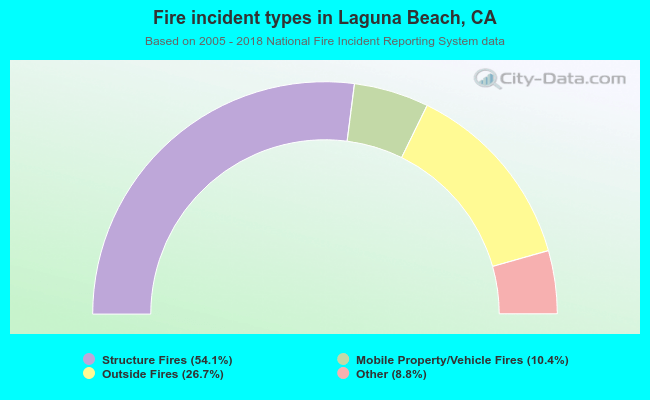 When looking into fire subcategories, the most incidents belonged to: Structure Fires (54.1%), and Outside Fires (26.7%).