Krum: Fire Incidents, Texas (TX)
Where are fire incidents reported in Krum, TX
Something went wrong! Please refresh the page.
|
| |||||||||||||||||||||||||||||||||||||||||||||||||||||||||||||||||||||||||||||||||||||||||||||||||||||||||||||
2002 - 2018 National Fire Incident Reporting System (NFIRS) incidents
- Incident types reported to NFIRS in Krum, TX
- 1,58243.7%Rescue & EMS
- 72620.0%Fire
- 53514.8%Service Call
- 3499.6%Good Intent Call
- 2898.0%Hazardous Condition
- 1223.4%False Alarm
- 90.2%Special Incident
- 80.2%Severe Weather
- 40.1%Overpressure Rupture
- Fire incident types reported to NFIRS in Krum, TX
- 40355.5%Outside Fires
- 21429.5%Structure Fires
- 648.8%Mobile Property/Vehicle Fires
- 456.2%Other
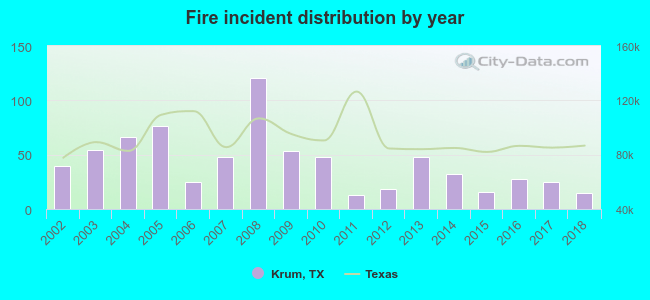 Based on the data from the years 2002 - 2018 the average number of fire incidents per year is 43. The highest number of reported fires - 121 took place in 2008, and the least - 13 in 2011. The data has a declining trend.
 The median response time based on all reported fire incidents is 9 minutes. This is higher than the state median value.
The median response time in Krum, TX compared to nearest cities:
(Note: Based on data for all years, including only cities with at least 500 fire incidents)
| Krum: | 9 minutes |
| Denton: | 6 minutes |
| Sanger: | 11 minutes |
| Argyle: | 9 minutes |
| Corinth: | 6 minutes |
| Justin: | 10 minutes |
| Aubrey: | 9 minutes |
| Highland Village: | 7 minutes |
| Valley View: | 12 minutes |
 25.1% incidents where reported in the morning and 74.9% in the evening. The most fires (19.8%) took place on Saturday, and the least (11.7%) on Wednesday.
 According to the 726 reports from years 2002 - 2018 most fires (12.3%) took place during July, and the least (5.0%) in April.
 Out of all 3,624 cases reported during the years 2002 - 2018, the most belonged to the categories: Rescue & EMS (43.7%), Fire (20.0%), and Service Call (14.8%).
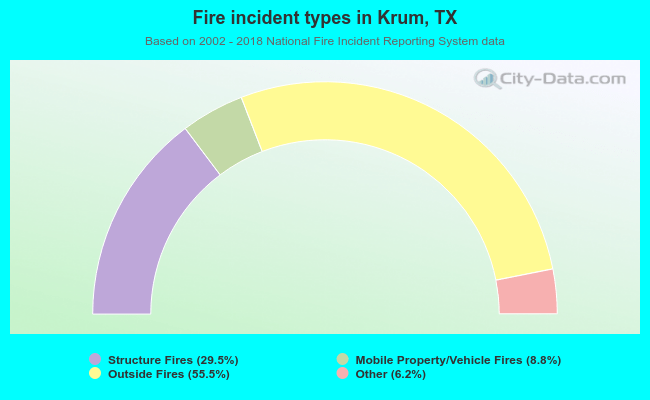 When looking into fire subcategories, the most reports belonged to: Outside Fires (55.5%), and Structure Fires (29.5%).