| Fire incidents reported |
|---|
| Sreet name | Count |
|---|
| INTERSTATE 74 | 28 | | STEAKHOUSE RD | 18 | | MAIN ST | 14 | | MINE RD | 12 | | BROAD ST | 10 | | BAREFOOT RD | 8 | | BLAZE RD | 8 | | MARKET ST | 8 | | US HWY 150E | 8 | | WILLIAM DR | 8 | | ANN ST | 6 | | FLEISHER RD | 6 | | I74 | 6 | | KNOX HIGHWAY 8 | 6 | | KNOX RD 1020E | 6 | | 508 EAST MILL | 4 | | DIVISION ST | 4 | | DOUGLAS ST | 4 | | GALESBURG RD | 4 | | HEBARD ST | 4 | | JAMES KNOX PARK | 4 | | KNOX HWY 9 | 4 | | NEWMAN ST | 4 | | NORTH ST | 4 | | OLD POST RD | 4 |
| | | Fire incidents reported |
|---|
| Sreet name | Count |
|---|
| OLD WAGON RD | 4 | | STEAKHOUSE RD | 4 | | SWEDENBURG RD | 4 | | 100 SOUTH LINE | 2 | | 1003 EAST MAIN | 2 | | 101 OAKVIEW | 2 | | 1035 BLAZE RD | 2 | | 1035 BLAZE ROAD | 2 | | 1060 STEAKHOUSE RD | 2 | | 1080 | 2 | | 1124 PHEASANT DR | 2 | | 1151 KNOX HIGHWAY 17 | 2 | | 1151 KNOX HWY 17 RD | 2 | | 1180 EAKER RD. | 2 | | 119 OAK VIEW COURT | 2 | | 1196 OLD WAGEN RD. RD | 2 | | 1200 BLK COUNTY HWY, 97 RD | 2 | | 1206 KNOX HWY 8 HWY | 2 | | 1232 STEAKHOUSE ROAD | 2 | | 1234 STEAKHOUSE ROAD | 2 | | 1284 KNOX HWY 8 | 2 | | 1300 BLK COUNTY 12 RD | 2 | | 1300 BLOCK OF KNOX HWY 11 | 2 | | 1321 US HWY 150 E | 2 | | |
|
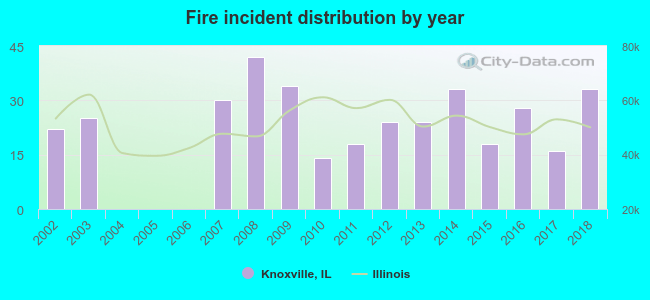 According to the data from the years 2002 - 2018 the average number of fire incidents per year is 21. The highest number of fire incidents - 42 took place in 2008, and the least - 0 in 2004. The data has a growing trend.
 24.1% incidents where reported in the morning and 75.9% in the evening. The most fires (18.0%) took place on Tuesday, and the least (10.8%) on Thursday.
 Based on the 361 fire incident reports from years 2002 - 2018 most fires (17.5%) took place during April, and the least (2.5%) in February.
 Out of all 1,474 cases reported during the years 2002 - 2018, the most belonged to the categories: Rescue & EMS (53.3%), Fire (24.5%), and Good Intent Call (9.0%).
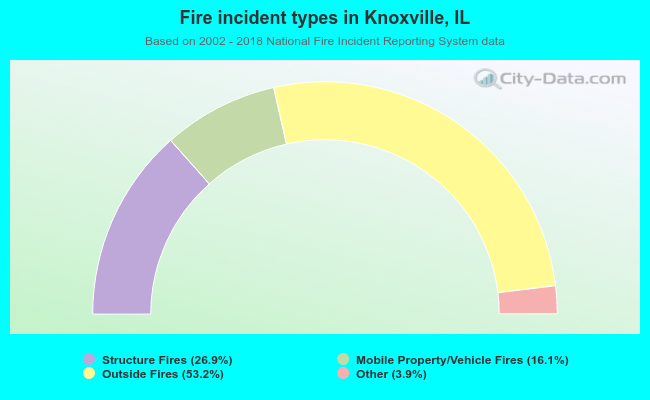 When looking into fire subcategories, the most reports belonged to: Outside Fires (53.2%), and Structure Fires (26.9%).