Knollwood: Fire Incidents, Illinois (IL)
Where are fire incidents reported in Knollwood, IL
Something went wrong! Please refresh the page.
|
| |||||||||||||||||||||||||||||||||||||||||||||||||||||||||||||||||||||||||||||||||||||||||||||||||||||||||||||
2002 - 2018 National Fire Incident Reporting System (NFIRS) incidents
- Incident types reported to NFIRS in Knollwood, IL
- 88852.1%Rescue & EMS
- 25815.1%Fire
- 23213.6%Hazardous Condition
- 1438.4%False Alarm
- 1005.9%Good Intent Call
- 834.9%Service Call
- Fire incident types reported to NFIRS in Knollwood, IL
- 12146.9%Structure Fires
- 7127.5%Outside Fires
- 3714.3%Other
- 2911.2%Mobile Property/Vehicle Fires
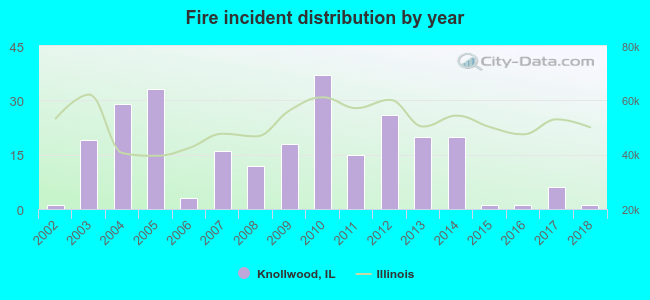 According to the data from the years 2002 - 2018 the average number of fire incidents per year is 15. The highest number of fire incidents - 37 took place in 2010, and the least - 1 in 2002. The data has a constant trend.
 28.3% incidents where reported in the morning and 71.7% in the evening. The most fires (18.6%) took place on Tuesday, and the least (10.1%) on Friday.
 According to the 258 fires from years 2002 - 2018 most fires (12.4%) took place during July, and the least (5.4%) in August.
 Out of all 1,706 cases reported during the years 2002 - 2018, the most belonged to the categories: Overpressure Rupture (52.1%), Fire (15.1%), and Rescue & EMS (13.6%).
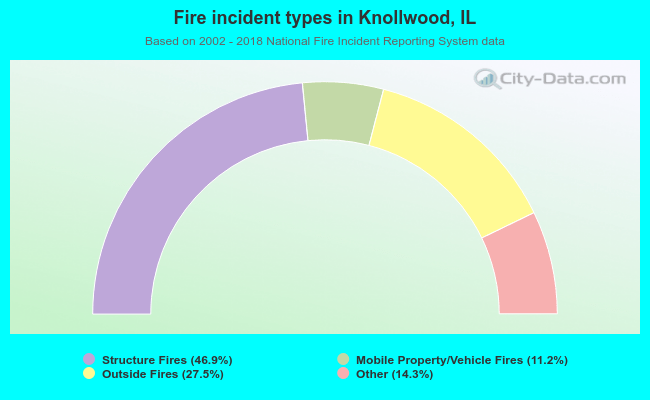 When looking into fire subcategories, the most incidents belonged to: Structure Fires (46.9%), and Outside Fires (27.5%).