Kirkwood: Fire Incidents, Missouri (MO)
Where are fire incidents reported in Kirkwood, MO
Something went wrong! Please refresh the page.
| Fire incidents reported | |
|---|---|
| Sreet name | Count |
| KIRKWOOD RD | 356 |
| BIG BEND BLVD | 102 |
| MANCHESTER RD | 102 |
| ADAMS AVE | 58 |
| GEYER RD | 52 |
| 270 | 46 |
| TAYLOR AVE | 46 |
| HARRISON AVE | 40 |
| TIMBERVIEW RD | 40 |
| MARSHALL RD | 38 |
| MANCHESTER RD | 36 |
| COUCH AVE | 34 |
| WOODBINE AVE | 34 |
| ARGONNE DR | 32 |
| CLAY AVE | 30 |
| ESSEX AVE | 28 |
| JEFFERSON AVE | 24 |
| OLD BIG BEND RD | 24 |
| ALSOBROOK ST | 22 |
| BALLAS RD | 22 |
| HOLMES AVE | 22 |
| INTERSTATE 44 HIGHWAY | 20 |
| NEW YORK ST | 20 |
| WOODGATE DR | 20 |
| ROCKRIDGE PL | 18 |
| SIGNAL HILLS DR | 18 |
| ALTUS PL | 16 |
| BODLEY AVE | 16 |
| DOUGHERTY FERRY RD | 16 |
| EVANS AVE | 16 |
| Other | 239 |
2002 - 2018 National Fire Incident Reporting System (NFIRS) incidents
- Incident types reported to NFIRS in Kirkwood, MO
- 9,36753.6%Rescue & EMS
- 2,45014.0%Hazardous Condition
- 1,5879.1%Fire
- 1,4608.4%False Alarm
- 1,2637.2%Good Intent Call
- 1,1586.6%Service Call
- 1460.8%Special Incident
- 250.1%Overpressure Rupture
- Fire incident types reported to NFIRS in Kirkwood, MO
- 77148.6%Structure Fires
- 45128.4%Outside Fires
- 22214.0%Mobile Property/Vehicle Fires
- 1439.0%Other
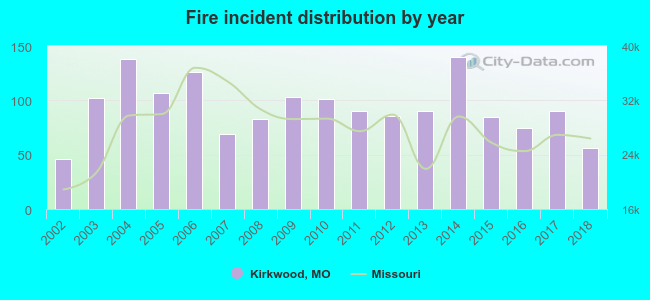 According to the data from the years 2002 - 2018 the average number of fire incidents per year is 93. The highest number of reported fire incidents - 140 took place in 2014, and the least - 46 in 2002. The data has a growing trend.
The average number of yearly fire incidents per 10k residents in Kirkwood, MO compared to nearest cities:
(Note: Based on data for the last 3 years, including only cities with population 5,000 and above)
| Kirkwood: | 26.6 |
| Glendale: | 11.3 |
| Des Peres: | 19.9 |
| Crestwood: | 22.6 |
| Sunset Hills: | 39.5 |
| Webster Groves: | 24.9 |
| Ladue: | 48.2 |
| Valley Park: | 33.4 |
| Brentwood: | 51.4 |
 The median response time based on all reported fire incidents is 5 minutes. This is lower compared to the Missouri median value.
The median response time in Kirkwood, MO compared to nearest cities:
(Note: Based on data for all years, including only cities with at least 500 fire incidents)
| Kirkwood: | 5 minutes |
| Crestwood: | 4 minutes |
| Sunset Hills: | 5 minutes |
| Webster Groves: | 5 minutes |
| Fenton: | 6 minutes |
| Ladue: | 6 minutes |
| Valley Park: | 6 minutes |
| Brentwood: | 4 minutes |
| Shrewsbury: | 5 minutes |
 According to the data from the years 2002 - 2018 the average number of fire-related casualties per year is 0. The highest number of reported casualties - 3 took place in 2003, and the lowest - 0 in 2002. The data has a constant trend.
The average number of casualties per 1,000 fire incidents is 4. This indicator was the highest - 29 in 2003, and the lowest 0 in 2002. The trend for injuries per 1,000 incidents is constant. Compared to the Missouri value the number of injuries per 1,000 fires is lower.
According to the data from the years 2002 - 2018 the average number of fire-related casualties per year is 0. The highest number of reported casualties - 3 took place in 2003, and the lowest - 0 in 2002. The data has a constant trend.
The average number of casualties per 1,000 fire incidents is 4. This indicator was the highest - 29 in 2003, and the lowest 0 in 2002. The trend for injuries per 1,000 incidents is constant. Compared to the Missouri value the number of injuries per 1,000 fires is lower.Casualties per 1,000 incidents in Kirkwood, MO compared to nearest cities:
(Note: Based on data for all years, including only cities with at least 500 fire incidents)
| Kirkwood: | 3.8 |
| Crestwood: | 27.4 |
| Sunset Hills: | 3.4 |
| Webster Groves: | 1.2 |
| Fenton: | 2.4 |
| Ladue: | 1.7 |
| Valley Park: | 4.4 |
| Brentwood: | 1.4 |
| Shrewsbury: | 5.7 |
 28.7% incidents where reported in the morning and 71.3% in the evening. The most fires (16.2%) took place on Sunday, and the least (12.9%) on Tuesday.
 Based on the 1,587 incident reports from years 2002 - 2018 most fires (10.5%) took place during July, and the least (5.4%) in September.
 Out of all 17,471 cases reported during the years 2002 - 2018, the most belonged to the categories: Rescue & EMS (53.6%), Hazardous Condition (14.0%), and Fire (9.1%).
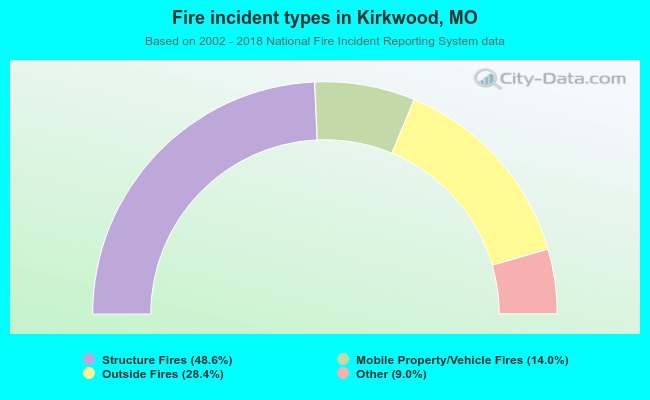 When looking into fire subcategories, the most incidents belonged to: Structure Fires (48.6%), and Outside Fires (28.4%).