Kirkwood: Fire Incidents, Illinois (IL)
Where are fire incidents reported in Kirkwood, IL
Something went wrong! Please refresh the page.
|
| |||||||||||||||||||||||||||||||||||||||||||||||||||||||||||||||||||||||||||||||||||||||||||||||||||||||||||||
2005 - 2018 National Fire Incident Reporting System (NFIRS) incidents
- Incident types reported to NFIRS in Kirkwood, IL
- 16238.8%Rescue & EMS
- 15537.1%Fire
- 6816.3%Hazardous Condition
- 153.6%Good Intent Call
- 102.4%Service Call
- 61.4%Severe Weather
- 20.5%False Alarm
- Fire incident types reported to NFIRS in Kirkwood, IL
- 7447.7%Outside Fires
- 5233.5%Structure Fires
- 2415.5%Mobile Property/Vehicle Fires
- 53.2%Other
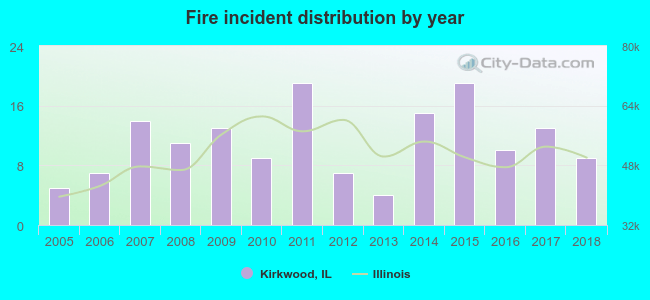 According to the data from the years 2005 - 2018 the average number of fire incidents per year is 11. The highest number of fire incidents - 19 took place in 2011, and the least - 4 in 2013. The data has a growing trend.
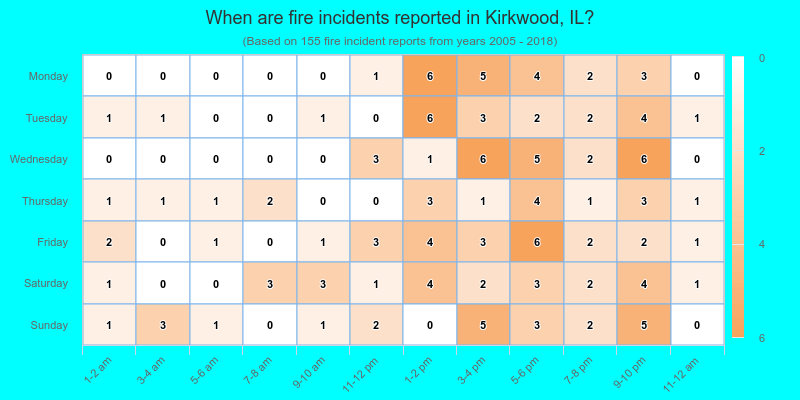
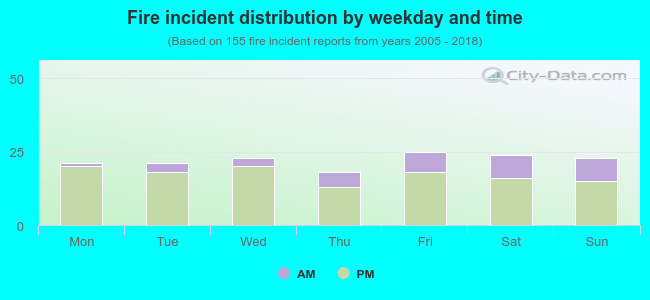 22.6% incidents where reported in the morning and 77.4% in the evening. The most fires (16.1%) took place on Friday, and the least (11.6%) on Thursday.
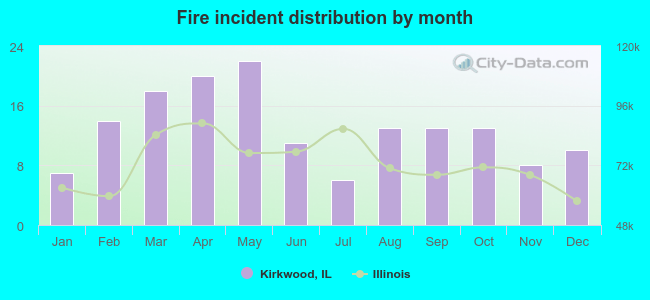 Based on the 155 fire incident reports from years 2005 - 2018 most fires (14.2%) took place during May, and the least (3.9%) in July.
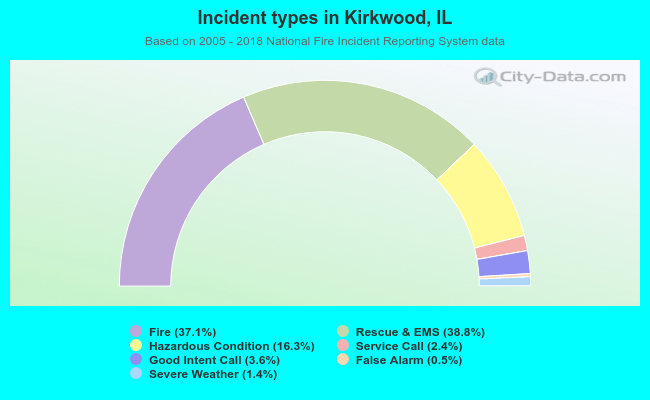 Out of all 418 cases reported during the years 2005 - 2018, the most belonged to the categories: Overpressure Rupture (38.8%), Fire (37.1%), and Rescue & EMS (16.3%).
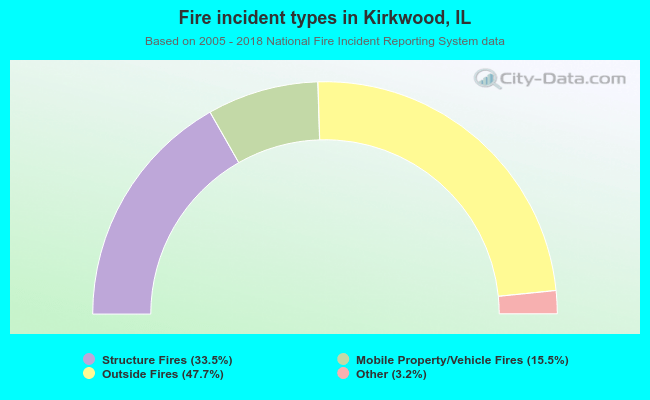 When looking into fire subcategories, the most reports belonged to: Outside Fires (47.7%), and Structure Fires (33.5%).