| Fire incidents reported |
|---|
| Sreet name | Count |
|---|
| 1000 | 6 | | 1000 E | 6 | | 500 S | 6 | | BOONE COUNTY | 6 | | MAIN ST | 6 | | PIKE | 6 | | US 421 | 6 | | 1100 E | 4 | | 1200 E | 4 | | 1300 EAST | 4 | | 500 E | 4 | | CO RD 750 N BOONE COUNTY | 4 | | JEFFERSON ST | 4 | | JEFFERSON STREET | 4 | | MAIN & FRANCSIE | 4 | | PERRY ST | 4 | | STATE ROAD 38 | 4 | | 1/2 MILE NORTH OF 421 | 2 | | 1000 E BOONE CO | 2 | | 10358 E 600 S | 2 | | 105 N PERRY ST | 2 | | 105 WEST HARRISON ST | 2 | | 108 S PIKE | 2 | | 1100E & 400S | 2 | | 11570 E STATE ROAD 28 | 2 |
| | | Fire incidents reported |
|---|
| Sreet name | Count |
|---|
| 1200 E | 2 | | 1200 E 180 S | 2 | | 1300 E | 2 | | 1300 E 600 S | 2 | | 13412 E 600 SOUTH | 2 | | 1575 KIRKLIN BRICK ROAD | 2 | | 200 E | 2 | | 200 N | 2 | | 203 W MADISON | 2 | | 250 S | 2 | | 296TH ST | 2 | | 300 S AND 350 S | 2 | | 300 SOUTH BTWN 400 & 500E | 2 | | 305 E MONROE ST | 2 | | 307 N PERRY | 2 | | 308 N PERRY ST | 2 | | 310 E MADISON ST | 2 | | 311 W MONROE ST | 2 | | 350 S 1300 E | 2 | | 375 E | 2 | | 400 EAST BOONE CO. | 2 | | 400 S | 2 | | 402 W JEFFERSON ST | 2 | | 405 E. JEFFERSON | 2 | | |
|
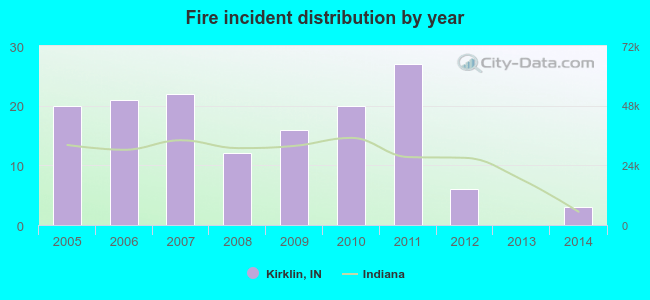 Based on the data from the years 2005 - 2014 the average number of fire incidents per year is 15. The highest number of reported fires - 27 took place in 2011, and the least - 0 in 2013. The data has a dropping trend.
 24.5% incidents where reported in the morning and 75.5% in the evening. The most fires (19.0%) took place on Saturday, and the least (11.6%) on Monday.
 Based on the 147 fire incidents from years 2005 - 2014 most fires (13.6%) took place during April, and the least (4.8%) in September.
 Out of all 214 cases reported during the years 2005 - 2014, the most belonged to the categories: Fire (68.7%), Overpressure Rupture (15.4%), and Rescue & EMS (7.5%).
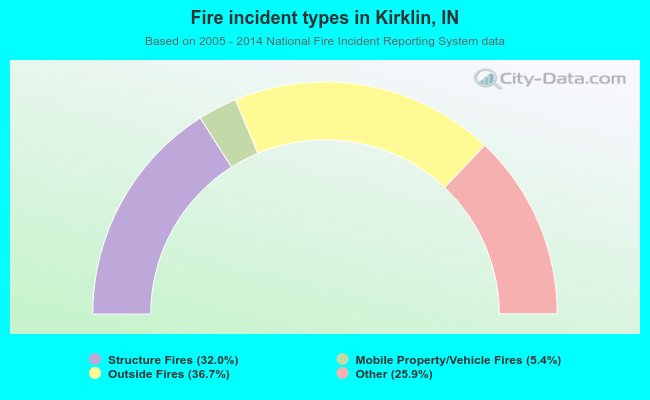 When looking into fire subcategories, the most reports belonged to: Outside Fires (36.7%), and Structure Fires (32.0%).