Kirby: Fire Incidents, Texas (TX)
Where are fire incidents reported in Kirby, TX
Something went wrong! Please refresh the page.
|
| |||||||||||||||||||||||||||||||||||||||||||||||||||||||||||||||||||||||||||||||||||||||||||||||||||||||||||||
2005 - 2018 National Fire Incident Reporting System (NFIRS) incidents
- Incident types reported to NFIRS in Kirby, TX
- 87046.5%Rescue & EMS
- 41622.2%Fire
- 1739.3%Good Intent Call
- 1699.0%Hazardous Condition
- 1256.7%False Alarm
- 1065.7%Service Call
- 50.3%Overpressure Rupture
- 50.3%Special Incident
- Fire incident types reported to NFIRS in Kirby, TX
- 18544.5%Structure Fires
- 15737.7%Outside Fires
- 4210.1%Mobile Property/Vehicle Fires
- 327.7%Other
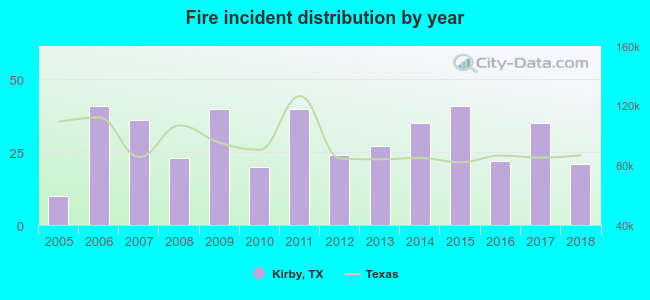 According to the data from the years 2005 - 2018 the average number of fires per year is 30. The highest number of reported fires - 41 took place in 2006, and the least - 10 in 2005. The data has an increasing trend.
The average number of yearly fire incidents per 10k residents in Kirby, TX compared to nearest cities:
(Note: Based on data for the last 3 years, including only cities with population 5,000 and above)
| Kirby: | 30.8 |
| Terrell Hills: | 7.7 |
| Windcrest: | 17.5 |
| Alamo Heights: | 27.3 |
| Converse: | 21.2 |
| Live Oak: | 4.0 |
| San Antonio: | 25.7 |
| Universal City: | 28.7 |
| Selma: | 31.4 |
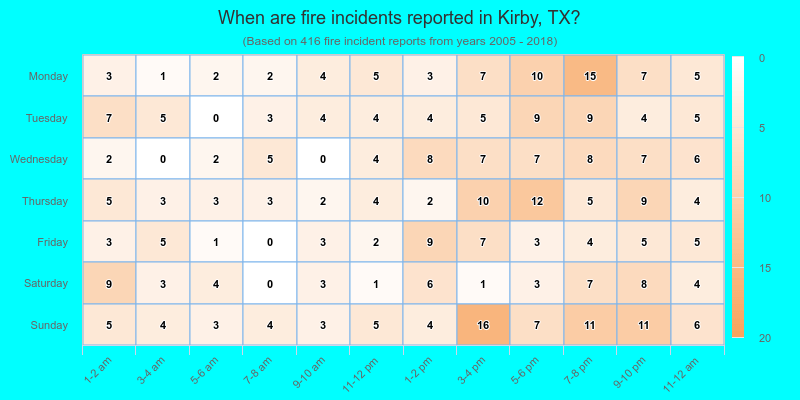
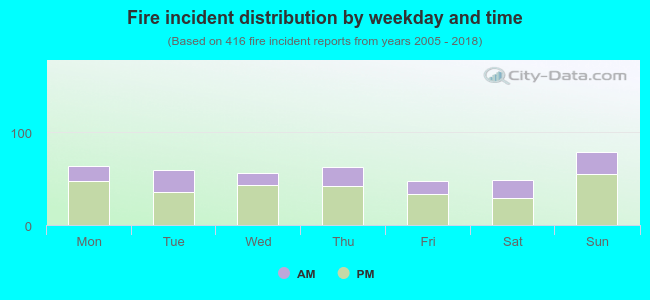 31.5% incidents where reported in the morning and 68.5% in the evening. The most fires (19.0%) took place on Sunday, and the least (11.3%) on Friday.
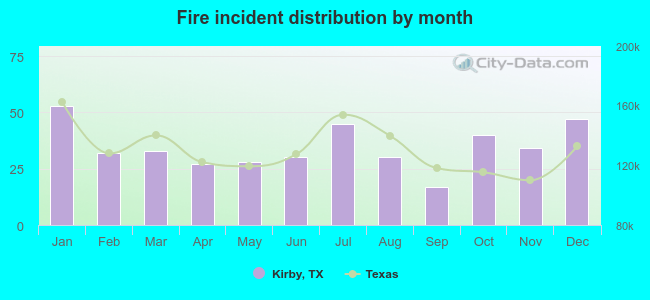 Based on the 416 reports from years 2005 - 2018 most fires (12.7%) took place during January, and the least (4.1%) in September.
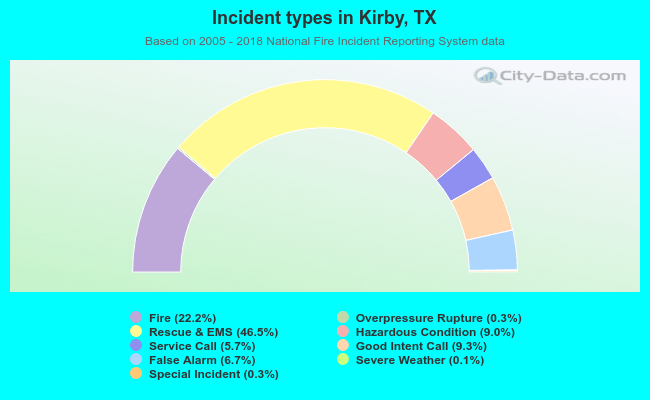 Out of all 1,870 cases reported during the years 2005 - 2018, the most belonged to the categories: Rescue & EMS (46.5%), Fire (22.2%), and Good Intent Call (9.3%).
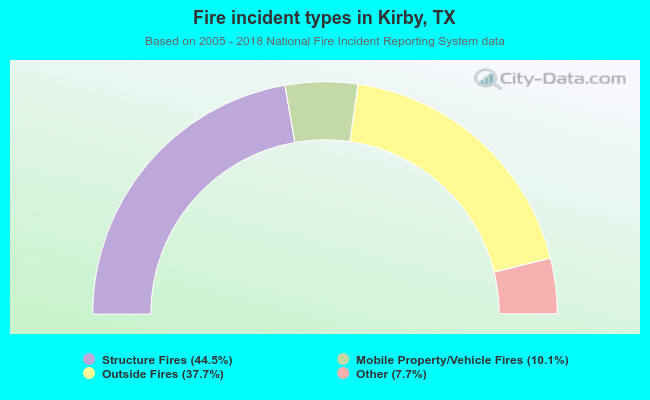 When looking into fire subcategories, the most incidents belonged to: Structure Fires (44.5%), and Outside Fires (37.7%).