Kinmundy: Fire Incidents, Illinois (IL)
Where are fire incidents reported in Kinmundy, IL
Something went wrong! Please refresh the page.
|
| |||||||||||||||||||||||||||||||||||||||||||||||||||||||||||||||||||||||||||||||||||||||||||||||||||||||||||||
| Other | 3 | |||||||||||||||||||||||||||||||||||||||||||||||||||||||||||||||||||||||||||||||||||||||||||||||||||||||||||||
2002 - 2018 National Fire Incident Reporting System (NFIRS) incidents
- Incident types reported to NFIRS in Kinmundy, IL
- 29551.9%Fire
- 12722.4%Hazardous Condition
- 10819.0%Rescue & EMS
- 274.8%Good Intent Call
- 30.5%Overpressure Rupture
- 30.5%Service Call
- 30.5%False Alarm
- 20.4%Severe Weather
- Fire incident types reported to NFIRS in Kinmundy, IL
- 16054.2%Outside Fires
- 8528.8%Structure Fires
- 5016.9%Mobile Property/Vehicle Fires
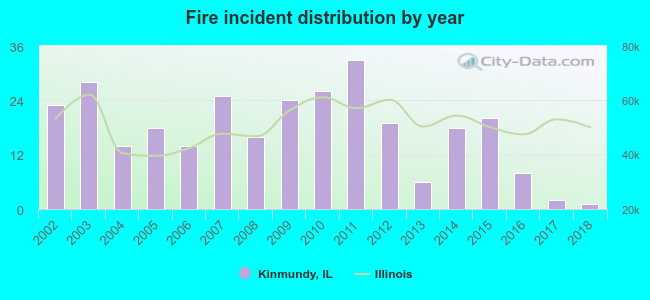 According to the data from the years 2002 - 2018 the average number of fire incidents per year is 17. The highest number of fire incidents - 33 took place in 2011, and the least - 1 in 2018. The data has a dropping trend.
 20.7% incidents where reported in the morning and 79.3% in the evening. The most fires (19.0%) took place on Wednesday, and the least (10.5%) on Thursday.
 Based on the 295 fire incident reports from years 2002 - 2018 most fires (16.3%) took place during March, and the least (4.4%) in May.
 Out of all 568 cases reported during the years 2002 - 2018, the most belonged to the categories: Fire (51.9%), Hazardous Condition (22.4%), and Rescue & EMS (19.0%).
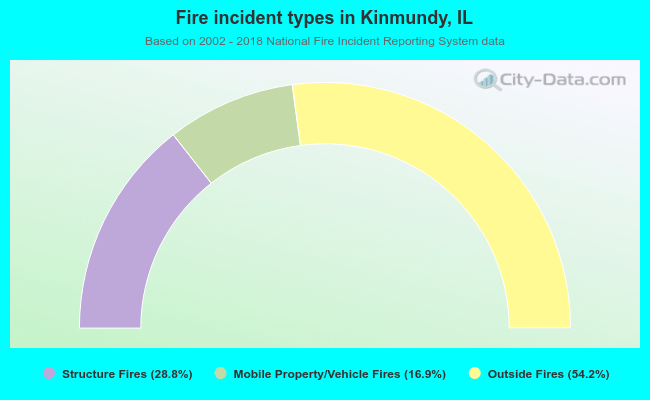 When looking into fire subcategories, the most reports belonged to: Outside Fires (54.2%), and Structure Fires (28.8%).