Kingwood: Fire Incidents, West Virginia (WV)
Where are fire incidents reported in Kingwood, WV
Something went wrong! Please refresh the page.
|
| |||||||||||||||||||||||||||||||||||||||||||||||||||||||||||||||||||||||||||||||||||||||||||||||||||||||||||||
| Other | 58 | |||||||||||||||||||||||||||||||||||||||||||||||||||||||||||||||||||||||||||||||||||||||||||||||||||||||||||||
2003 - 2018 National Fire Incident Reporting System (NFIRS) incidents
- Incident types reported to NFIRS in Kingwood, WV
- 99445.6%Hazardous Condition
- 41218.9%Fire
- 40218.4%Rescue & EMS
- 22510.3%Good Intent Call
- 843.9%False Alarm
- 452.1%Service Call
- 100.5%Special Incident
- 60.3%Severe Weather
- Fire incident types reported to NFIRS in Kingwood, WV
- 21051.0%Structure Fires
- 9322.6%Outside Fires
- 8019.4%Mobile Property/Vehicle Fires
- 297.0%Other
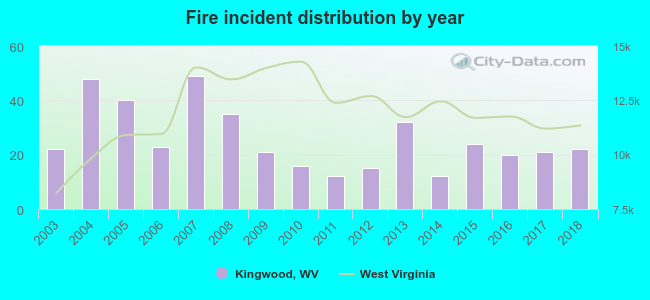 According to the data from the years 2003 - 2018 the average number of fires per year is 26. The highest number of fires - 49 took place in 2007, and the least - 12 in 2011. The data has a constant trend.
 According to the data from the years 2003 - 2018 the average number of fire-related casualties per year is 0. The highest number of injuries - 3 took place in 2004, and the lowest - 0 in 2003. The data has a constant trend.
 32.0% incidents where reported in the morning and 68.0% in the evening. The most fires (16.0%) took place on Saturday, and the least (12.1%) on Tuesday.
 According to the 412 reports from years 2003 - 2018 most fires (12.9%) took place during April, and the least (6.1%) in August.
 Out of all 2,179 cases reported during the years 2003 - 2018, the most belonged to the categories: Hazardous Condition (45.6%), Fire (18.9%), and Rescue & EMS (18.4%).
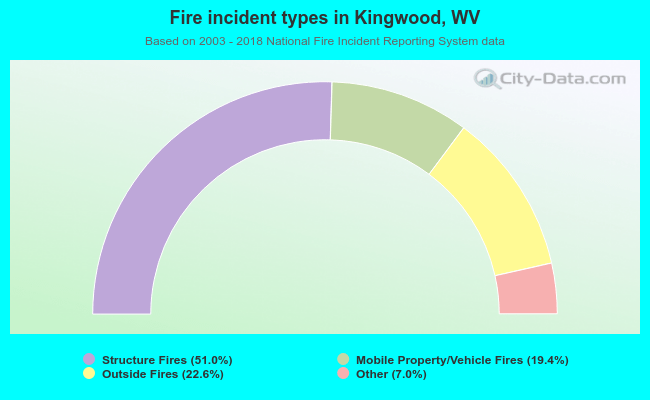 When looking into fire subcategories, the most incidents belonged to: Structure Fires (51.0%), and Outside Fires (22.6%).