Kingsford: Fire Incidents, Michigan (MI)
Where are fire incidents reported in Kingsford, MI
Something went wrong! Please refresh the page.
|
| |||||||||||||||||||||||||||||||||||||||||||||||||||||||||||||||||||||||||||||||||||||||||||||||||||||||||||||
2002 - 2018 National Fire Incident Reporting System (NFIRS) incidents
- Incident types reported to NFIRS in Kingsford, MI
- 16255.9%Fire
- 7826.9%Hazardous Condition
- 217.2%False Alarm
- 144.8%Service Call
- 62.1%Overpressure Rupture
- 62.1%Good Intent Call
- 20.7%Severe Weather
- 10.3%Rescue & EMS
- Fire incident types reported to NFIRS in Kingsford, MI
- 7848.1%Structure Fires
- 3722.8%Other
- 2716.7%Outside Fires
- 2012.3%Mobile Property/Vehicle Fires
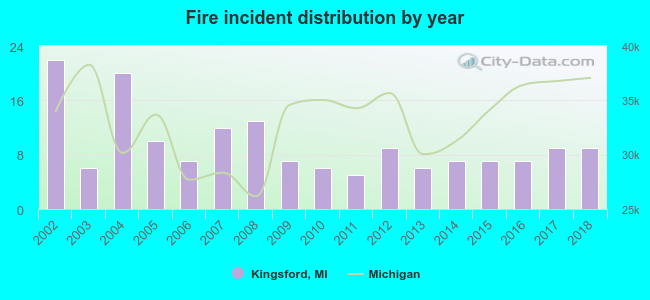 According to the data from the years 2002 - 2018 the average number of fire incidents per year is 10. The highest number of fire incidents - 22 took place in 2002, and the least - 5 in 2011. The data has a declining trend.
The average number of yearly fire incidents per 10k residents in Kingsford, MI compared to nearest cities:
(Note: Based on data for the last 3 years, including only cities with population 5,000 and above)
| Kingsford: | 16.3 |
| Iron Mountain: | 49.0 |
| Escanaba: | 23.6 |
| Ishpeming: | 50.5 |
| Menominee: | 48.1 |

 37.0% incidents where reported in the morning and 63.0% in the evening. The most fires (17.9%) took place on Friday, and the least (13.0%) on Wednesday.
 According to the 162 incident reports from years 2002 - 2018 most fires (13.6%) took place during August, and the least (4.9%) in January.
 Out of all 290 cases reported during the years 2002 - 2018, the most belonged to the categories: Fire (55.9%), Hazardous Condition (26.9%), and False Alarm (7.2%).
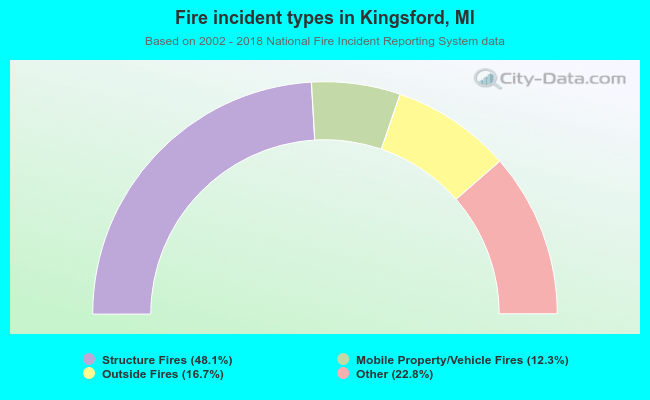 When looking into fire subcategories, the most reports belonged to: Structure Fires (48.1%), and Other (22.8%).