Kingsbury: Fire Incidents, New York (NY)
Where are fire incidents reported in Kingsbury, NY
Something went wrong! Please refresh the page.
|
| |||||||||||||||||||||||||||||||||||||||||||||||||||||||||||||||||||||||||||||||||||||||||||||||||||||||||||||
2002 - 2018 National Fire Incident Reporting System (NFIRS) incidents
- Incident types reported to NFIRS in Kingsbury, NY
- 10254.8%Fire
- 2714.5%Hazardous Condition
- 2614.0%Service Call
- 147.5%Good Intent Call
- 94.8%False Alarm
- 63.2%Rescue & EMS
- 21.1%Severe Weather
- Fire incident types reported to NFIRS in Kingsbury, NY
- 8583.3%Structure Fires
- 76.9%Outside Fires
- 54.9%Mobile Property/Vehicle Fires
- 54.9%Other
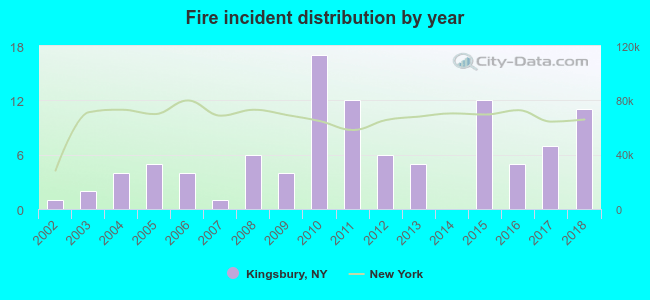 Based on the data from the years 2002 - 2018 the average number of fire incidents per year is 6. The highest number of fire incidents - 17 took place in 2010, and the least - 0 in 2014. The data has a rising trend.
The average number of yearly fire incidents per 10k residents in Kingsbury, NY compared to nearest cities:
(Note: Based on data for the last 3 years, including only cities with population 5,000 and above)
| Kingsbury: | 6.1 |
| Hudson Falls: | 56.3 |
| Glens Falls: | 37.4 |
| Moreau: | 11.1 |
| Queensbury: | 42.2 |
| Northumberland: | 2.0 |
| Wilton: | 11.3 |
| Saratoga Springs: | 38.1 |
| Greenfield: | 14.8 |
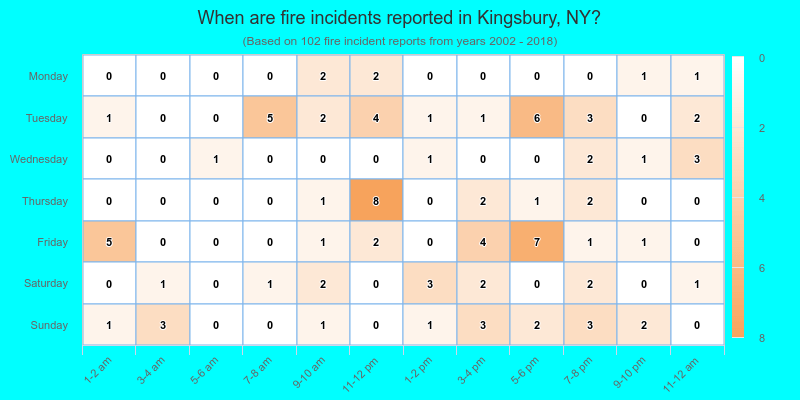
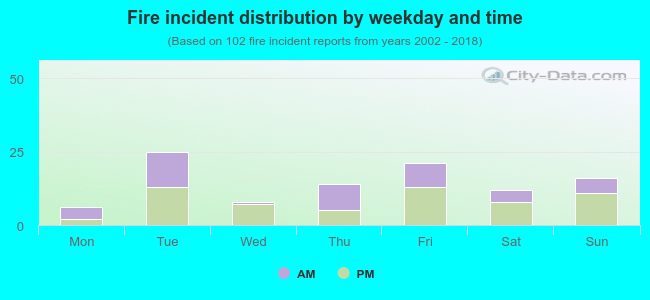 42.2% incidents where reported in the morning and 57.8% in the evening. The most fires (24.5%) took place on Tuesday, and the least (5.9%) on Monday.
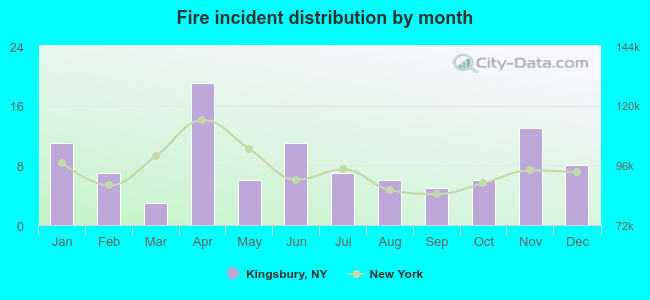 According to the 102 incident reports from years 2002 - 2018 most fires (18.6%) took place during April, and the least (2.9%) in March.
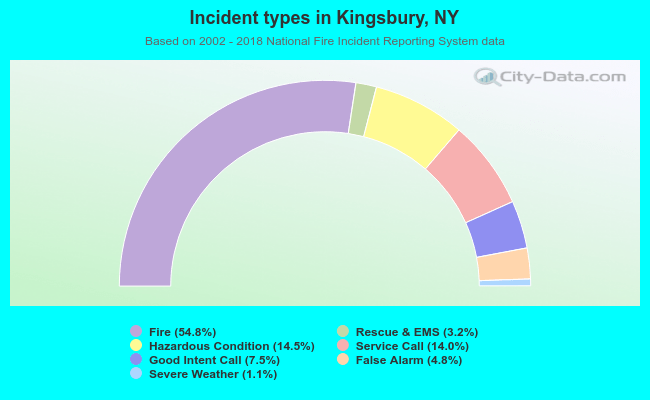 Out of all 186 cases reported during the years 2002 - 2018, the most belonged to the categories: Fire (54.8%), Rescue & EMS (14.5%), and Hazardous Condition (14.0%).
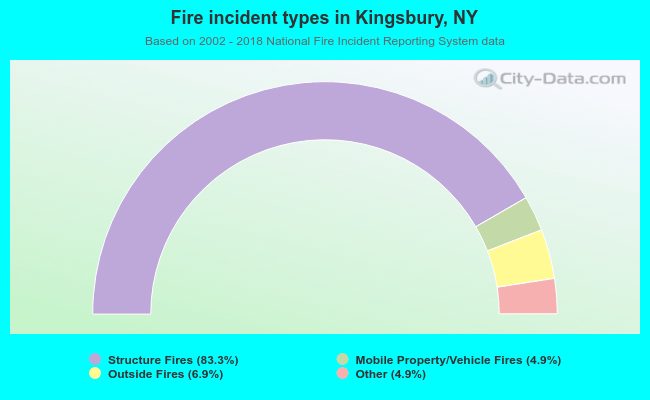 When looking into fire subcategories, the most reports belonged to: Structure Fires (83.3%), and Outside Fires (6.9%).