Kings Beach: Fire Incidents, California (CA)
Where are fire incidents reported in Kings Beach, CA
Something went wrong! Please refresh the page.
|
| |||||||||||||||||||||||||||||||||||||||||||||||||||||||||||||||||||||||||||||||||||||||||||||||||||||||||||||
2005 - 2018 National Fire Incident Reporting System (NFIRS) incidents
- Incident types reported to NFIRS in Kings Beach, CA
- 70147.0%Rescue & EMS
- 22214.9%Hazardous Condition
- 16611.1%Good Intent Call
- 1469.8%Fire
- 1449.7%Service Call
- 1087.2%False Alarm
- 20.1%Special Incident
- Fire incident types reported to NFIRS in Kings Beach, CA
- 7853.4%Structure Fires
- 4933.6%Outside Fires
- 128.2%Mobile Property/Vehicle Fires
- 74.8%Other
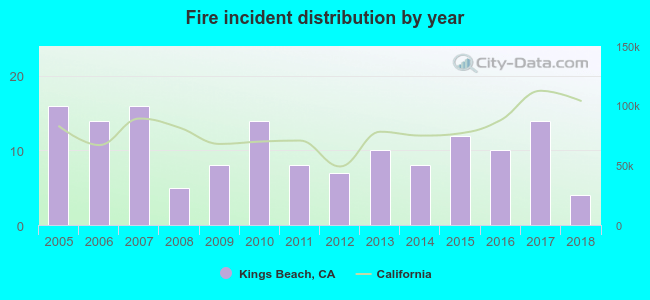 According to the data from the years 2005 - 2018 the average number of fires per year is 10. The highest number of fire incidents - 16 took place in 2005, and the least - 4 in 2018. The data has a decreasing trend.
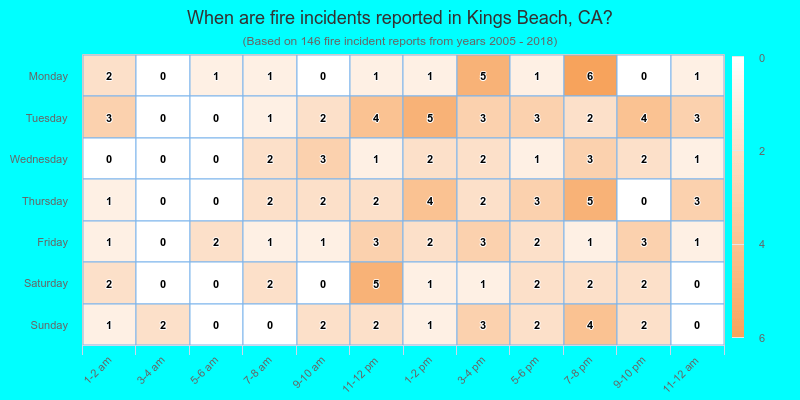
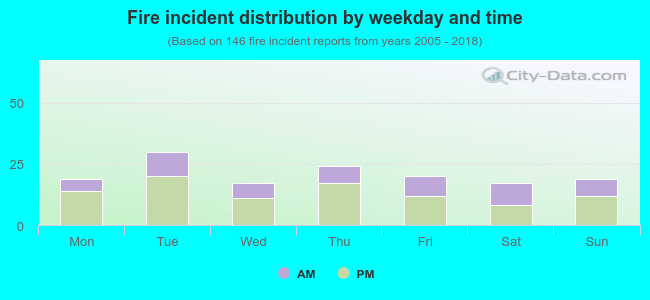 35.6% incidents where reported in the morning and 64.4% in the evening. The most fires (20.5%) took place on Tuesday, and the least (11.6%) on Wednesday.
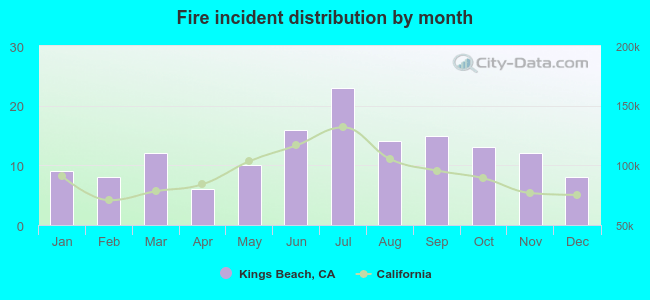 Based on the 146 incident reports from years 2005 - 2018 most fires (15.8%) took place during July, and the least (4.1%) in April.
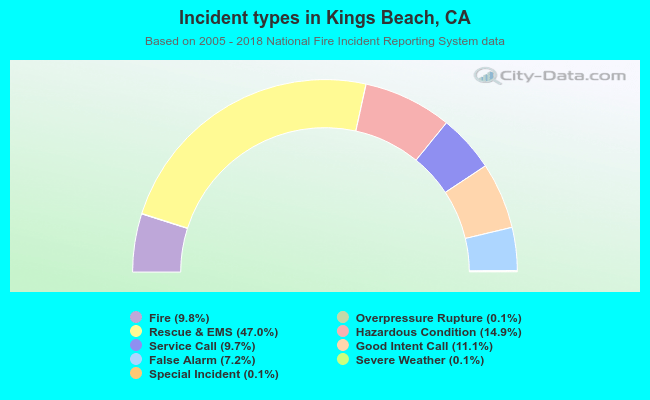 Out of all 1,491 cases reported during the years 2005 - 2018, the most belonged to the categories: Rescue & EMS (47.0%), Hazardous Condition (14.9%), and Good Intent Call (11.1%).
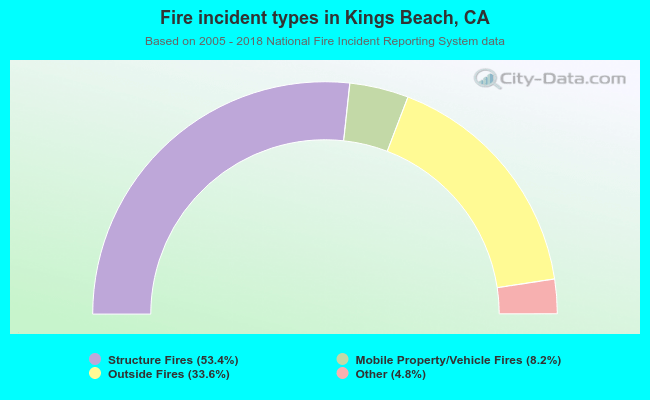 When looking into fire subcategories, the most reports belonged to: Structure Fires (53.4%), and Outside Fires (33.6%).