Killona: Fire Incidents, Louisiana (LA)
Where are fire incidents reported in Killona, LA
Something went wrong! Please refresh the page.
|
| |||||||||||||||||||||||||||||||||||||||||||||||||||||||||||||||||||||||||||||||||||||||||||||||||||||||||
2002 - 2018 National Fire Incident Reporting System (NFIRS) incidents
- Incident types reported to NFIRS in Killona, LA
- 13438.3%Fire
- 7822.3%Hazardous Condition
- 5214.9%Good Intent Call
- 4312.3%Rescue & EMS
- 216.0%Service Call
- 174.9%False Alarm
- 20.6%Severe Weather
- 20.6%Special Incident
- 10.3%Overpressure Rupture
- Fire incident types reported to NFIRS in Killona, LA
- 6044.8%Structure Fires
- 5339.6%Outside Fires
- 1914.2%Mobile Property/Vehicle Fires
- 21.5%Other
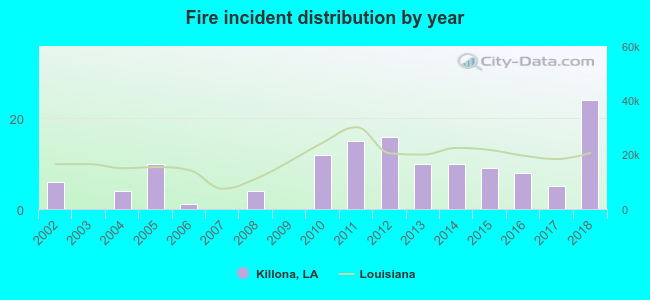 According to the data from the years 2002 - 2018 the average number of fire incidents per year is 8. The highest number of reported fires - 24 took place in 2018, and the least - 0 in 2003. The data has a growing trend.
 48.5% incidents where reported in the morning and 51.5% in the evening. The most fires (19.4%) took place on Saturday, and the least (9.7%) on Wednesday.
 According to the 134 reports from years 2002 - 2018 most fires (11.2%) took place during August, and the least (5.2%) in April.
 Out of all 350 cases reported during the years 2002 - 2018, the most belonged to the categories: Fire (38.3%), Hazardous Condition (22.3%), and Good Intent Call (14.9%).
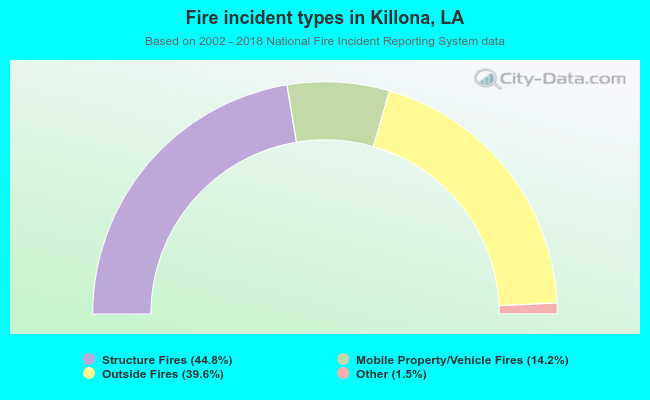 When looking into fire subcategories, the most incidents belonged to: Structure Fires (44.8%), and Outside Fires (39.6%).