Kewaunee: Fire Incidents, Wisconsin (WI)
Where are fire incidents reported in Kewaunee, WI
Something went wrong! Please refresh the page.
|
| |||||||||||||||||||||||||||||||||||||||||||||||||||||||||||||||||||||||||||||||||||||||||||||||||||||||||||||
2002 - 2018 National Fire Incident Reporting System (NFIRS) incidents
- Incident types reported to NFIRS in Kewaunee, WI
- 29758.0%Fire
- 6913.5%Hazardous Condition
- 6111.9%Rescue & EMS
- 346.6%Good Intent Call
- 214.1%False Alarm
- 183.5%Service Call
- 71.4%Special Incident
- 40.8%Severe Weather
- 10.2%Overpressure Rupture
- Fire incident types reported to NFIRS in Kewaunee, WI
- 18662.6%Structure Fires
- 6923.2%Outside Fires
- 3311.1%Mobile Property/Vehicle Fires
- 93.0%Other
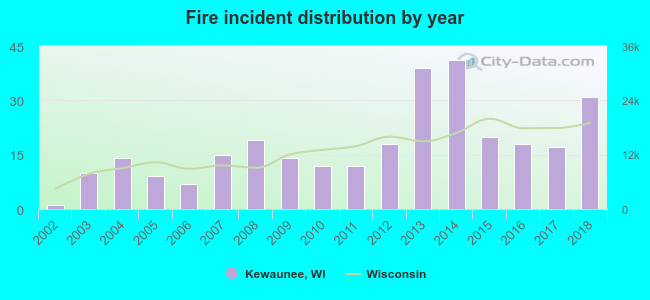 According to the data from the years 2002 - 2018 the average number of fire incidents per year is 17. The highest number of fire incidents - 41 took place in 2014, and the least - 1 in 2002. The data has a rising trend.
 33.7% incidents where reported in the morning and 66.3% in the evening. The most fires (15.5%) took place on Monday, and the least (10.8%) on Tuesday.
 According to the 297 fire incidents from years 2002 - 2018 most fires (11.4%) took place during March, and the least (6.1%) in February.
 Out of all 512 cases reported during the years 2002 - 2018, the most belonged to the categories: Fire (58.0%), Hazardous Condition (13.5%), and Rescue & EMS (11.9%).
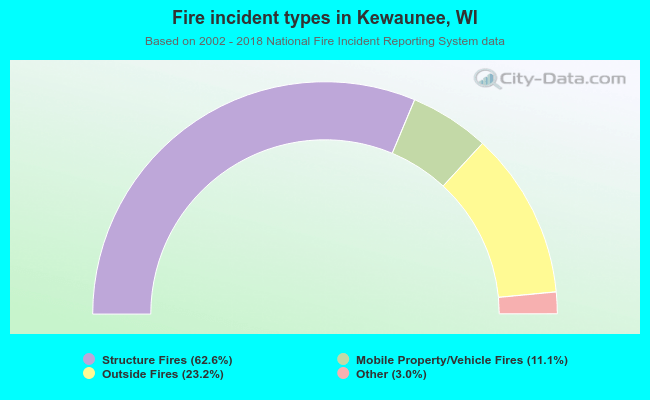 When looking into fire subcategories, the most incidents belonged to: Structure Fires (62.6%), and Outside Fires (23.2%).