Kewaskum: Fire Incidents, Wisconsin (WI)
Where are fire incidents reported in Kewaskum, WI
Something went wrong! Please refresh the page.
|
| |||||||||||||||||||||||||||||||||||||||||||||||||||||||||||||||||||||||||||||||||||||||||||||||||||||||||||||
| Other | 80 | |||||||||||||||||||||||||||||||||||||||||||||||||||||||||||||||||||||||||||||||||||||||||||||||||||||||||||||
2002 - 2018 National Fire Incident Reporting System (NFIRS) incidents
- Incident types reported to NFIRS in Kewaskum, WI
- 48543.8%Rescue & EMS
- 38835.0%Fire
- 11310.2%Hazardous Condition
- 575.1%False Alarm
- 433.9%Good Intent Call
- 171.5%Service Call
- 30.3%Severe Weather
- 20.2%Overpressure Rupture
- Fire incident types reported to NFIRS in Kewaskum, WI
- 20853.6%Structure Fires
- 11830.4%Outside Fires
- 4210.8%Mobile Property/Vehicle Fires
- 205.2%Other
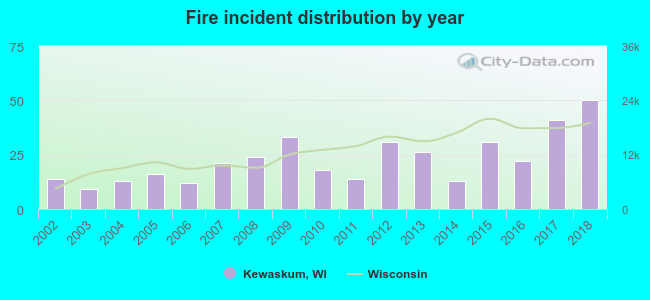 According to the data from the years 2002 - 2018 the average number of fire incidents per year is 23. The highest number of fire incidents - 50 took place in 2018, and the least - 9 in 2003. The data has a rising trend.
 35.8% incidents where reported in the morning and 64.2% in the evening. The most fires (21.4%) took place on Saturday, and the least (9.3%) on Tuesday.
 According to the 388 fire incidents from years 2002 - 2018 most fires (20.6%) took place during April, and the least (3.1%) in August.
 Out of all 1,108 cases reported during the years 2002 - 2018, the most belonged to the categories: Rescue & EMS (43.8%), Fire (35.0%), and Hazardous Condition (10.2%).
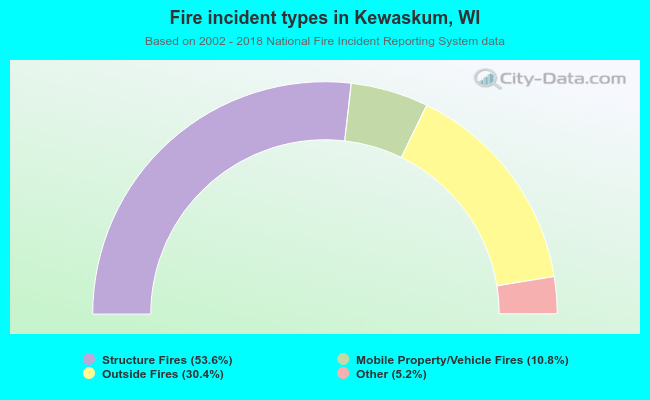 When looking into fire subcategories, the most incidents belonged to: Structure Fires (53.6%), and Outside Fires (30.4%).