Kellyville: Fire Incidents, Oklahoma (OK)
Where are fire incidents reported in Kellyville, OK
Something went wrong! Please refresh the page.
|
| |||||||||||||||||||||||||||||||||||||||||||||||||||||||||||||||||||||||||||||||||||||||||||||||||||||||||||||
| Other | 120 | |||||||||||||||||||||||||||||||||||||||||||||||||||||||||||||||||||||||||||||||||||||||||||||||||||||||||||||
2002 - 2018 National Fire Incident Reporting System (NFIRS) incidents
- Incident types reported to NFIRS in Kellyville, OK
- 44062.6%Fire
- 11816.8%Rescue & EMS
- 7510.7%Good Intent Call
- 375.3%Hazardous Condition
- 121.7%Service Call
- 101.4%False Alarm
- 50.7%Severe Weather
- 40.6%Special Incident
- 20.3%Overpressure Rupture
- Fire incident types reported to NFIRS in Kellyville, OK
- 30168.4%Outside Fires
- 10624.1%Structure Fires
- 296.6%Mobile Property/Vehicle Fires
- 40.9%Other
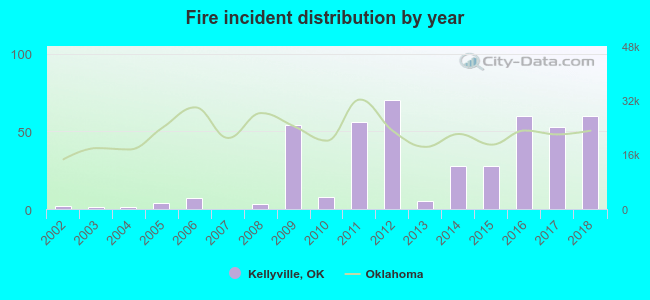 Based on the data from the years 2002 - 2018 the average number of fires per year is 26. The highest number of fires - 70 took place in 2012, and the least - 0 in 2007. The data has an increasing trend.
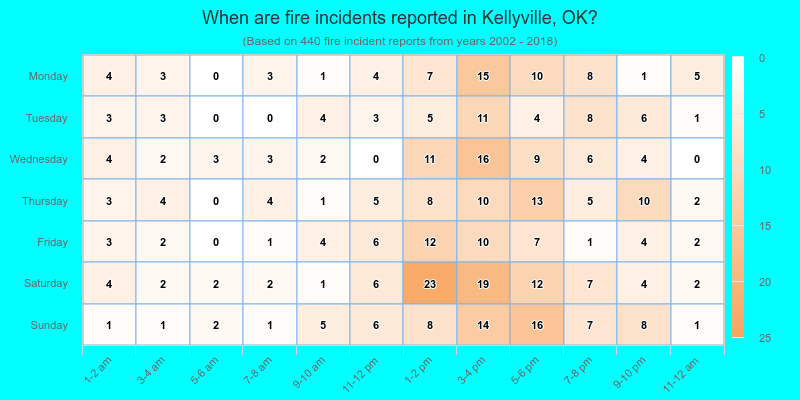
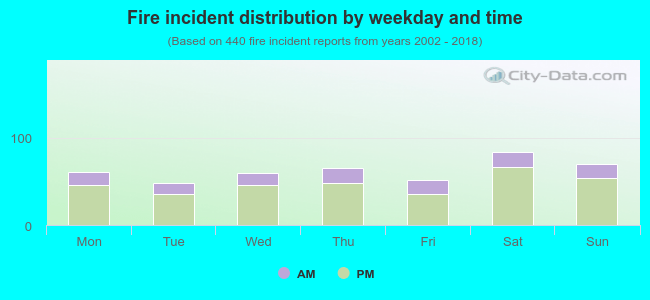 24.5% incidents where reported in the morning and 75.5% in the evening. The most fires (19.1%) took place on Saturday, and the least (10.9%) on Tuesday.
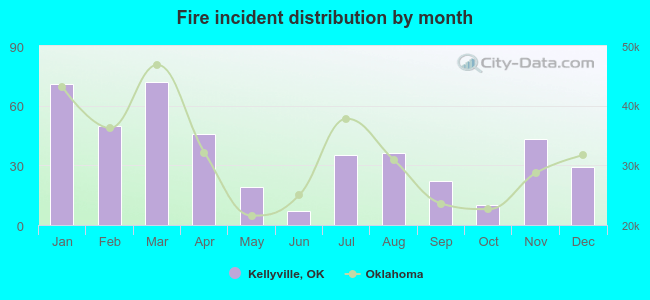 Based on the 440 fire incidents from years 2002 - 2018 most fires (16.4%) took place during March, and the least (1.6%) in June.
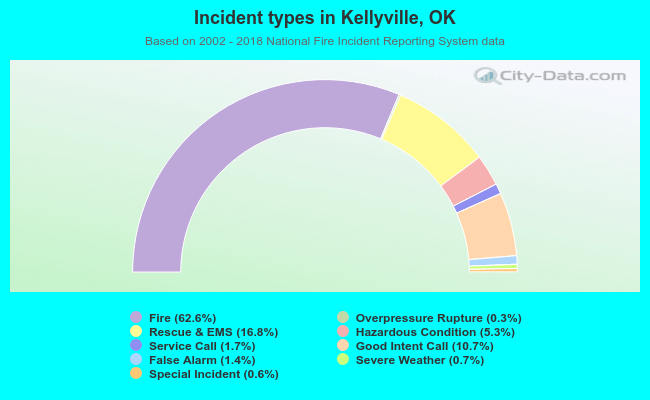 Out of all 703 cases reported during the years 2002 - 2018, the most belonged to the categories: Fire (62.6%), Rescue & EMS (16.8%), and Good Intent Call (10.7%).
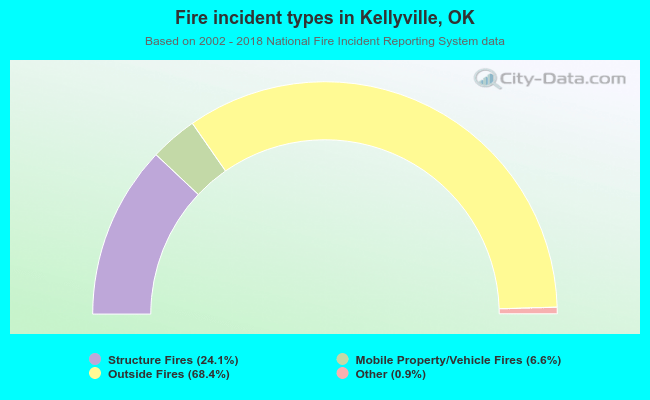 When looking into fire subcategories, the most reports belonged to: Outside Fires (68.4%), and Structure Fires (24.1%).