Kellogg: Fire Incidents, Iowa (IA)
Where are fire incidents reported in Kellogg, IA
Something went wrong! Please refresh the page.
|
| |||||||||||||||||||||||||||||||||||||||||||||||||||||||||||||||||||||||||||||||||||||||||||||||||||||||||||||
| Other | 8 | |||||||||||||||||||||||||||||||||||||||||||||||||||||||||||||||||||||||||||||||||||||||||||||||||||||||||||||
2003 - 2018 National Fire Incident Reporting System (NFIRS) incidents
- Incident types reported to NFIRS in Kellogg, IA
- 21452.3%Fire
- 12530.6%Rescue & EMS
- 307.3%Good Intent Call
- 245.9%Hazardous Condition
- 71.7%Service Call
- 51.2%Special Incident
- 20.5%False Alarm
- 10.2%Overpressure Rupture
- 10.2%Severe Weather
- Fire incident types reported to NFIRS in Kellogg, IA
- 10147.2%Outside Fires
- 6329.4%Structure Fires
- 3918.2%Mobile Property/Vehicle Fires
- 115.1%Other
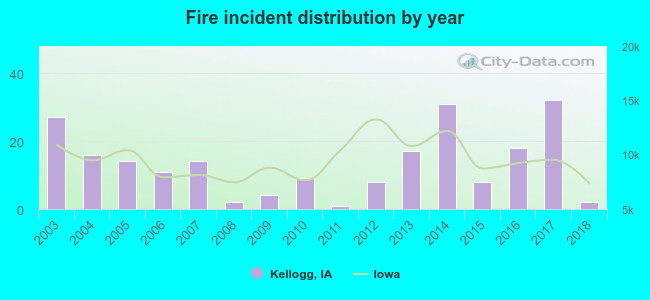 Based on the data from the years 2003 - 2018 the average number of fire incidents per year is 13. The highest number of reported fires - 32 took place in 2017, and the least - 1 in 2011. The data has a decreasing trend.
 25.2% incidents where reported in the morning and 74.8% in the evening. The most fires (18.7%) took place on Monday, and the least (8.9%) on Thursday.
 According to the 214 reports from years 2003 - 2018 most fires (17.8%) took place during March, and the least (4.2%) in June.
 Out of all 409 cases reported during the years 2003 - 2018, the most belonged to the categories: Fire (52.3%), Rescue & EMS (30.6%), and Good Intent Call (7.3%).
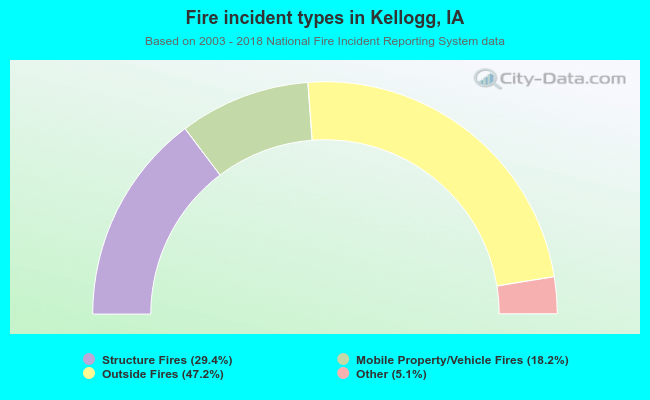 When looking into fire subcategories, the most incidents belonged to: Outside Fires (47.2%), and Structure Fires (29.4%).