Kalkaska: Fire Incidents, Michigan (MI)
Where are fire incidents reported in Kalkaska, MI
Something went wrong! Please refresh the page.
|
| |||||||||||||||||||||||||||||||||||||||||||||||||||||||||||||||||||||||||||||||||||||||||||||||||||||||||||||
| Other | 172 | |||||||||||||||||||||||||||||||||||||||||||||||||||||||||||||||||||||||||||||||||||||||||||||||||||||||||||||
2002 - 2018 National Fire Incident Reporting System (NFIRS) incidents
- Incident types reported to NFIRS in Kalkaska, MI
- 1,49856.9%Rescue & EMS
- 48618.5%Fire
- 27410.4%Hazardous Condition
- 26410.0%Good Intent Call
- 441.7%Service Call
- 401.5%False Alarm
- 160.6%Severe Weather
- 70.3%Special Incident
- 30.1%Overpressure Rupture
- Fire incident types reported to NFIRS in Kalkaska, MI
- 24650.6%Structure Fires
- 13828.4%Outside Fires
- 5811.9%Other
- 449.1%Mobile Property/Vehicle Fires
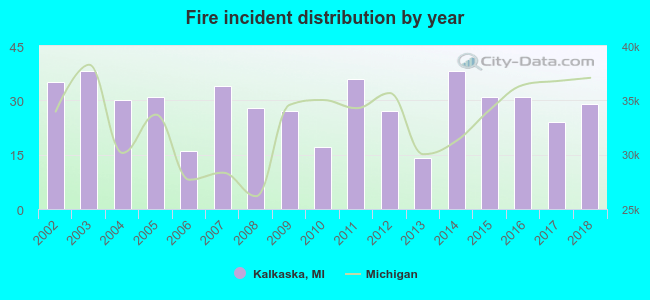 Based on the data from the years 2002 - 2018 the average number of fire incidents per year is 29. The highest number of fire incidents - 38 took place in 2003, and the least - 14 in 2013. The data has a declining trend.
 29.4% incidents where reported in the morning and 70.6% in the evening. The most fires (16.0%) took place on Friday, and the least (13.2%) on Tuesday.
 Based on the 486 reports from years 2002 - 2018 most fires (16.3%) took place during April, and the least (4.7%) in December.
 Out of all 2,632 cases reported during the years 2002 - 2018, the most belonged to the categories: Rescue & EMS (56.9%), Fire (18.5%), and Hazardous Condition (10.4%).
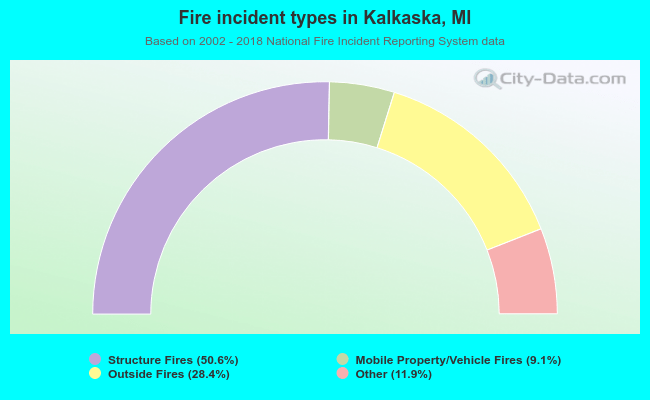 When looking into fire subcategories, the most reports belonged to: Structure Fires (50.6%), and Outside Fires (28.4%).