| Fire incidents reported |
|---|
| Sreet name | Count |
|---|
| JONESTOWN RD | 72 | | MARKET ST | 50 | | LANCASTER ST | 38 | | MILL ST | 26 | | GREBLE RD | 24 | | OUT OF DISTRICT | 24 | | AWOL RD | 22 | | INTERSTATE 81 HWY | 20 | | FISHER AVE | 18 | | HOOVER DR | 14 | | CREEK LN | 12 | | LICKDALE RD | 12 | | MOWERY RD | 12 | | CHESTNUT ST | 10 | | HEMLOCK HILL LN | 10 | | MICRO DR | 10 | | RACEHORSE DR. | 10 | | ALLENTOWN BLVD | 8 | | BORDNERSVILLE RD | 8 | | FORT SWATARA RD | 8 | | INTERSTATE 78 HWY | 8 | | LIGHTHOUSE DR | 8 | | PLYMOUTH DR | 8 | | RACEHORSE DR | 8 | | RT. 22 RT | 8 |
| | | Fire incidents reported |
|---|
| Sreet name | Count |
|---|
| SUEDBURG RD | 8 | | BROAD ST | 6 | | CINDY DR | 6 | | CREEK VIEW DR | 6 | | DRY CREEK LN | 6 | | GRACE AVE | 6 | | HUCKLEBERRY RD | 6 | | I-81 | 6 | | I81 | 6 | | LENOPE LN | 6 | | MELANIE LN | 6 | | MOUNTAIN RD | 6 | | MOUNTVILLE DR | 6 | | NORTH LANCASTER ST. | 6 | | OLD ROUTE 22 | 6 | | OLD STATE RD | 6 | | QUARRY RD. | 6 | | RACE HORSE DR | 6 | | SHEPHERD ST | 6 | | STATE ROUTE 72 HWY | 6 | | STATE RT 72 | 6 | | SWATARA CIR | 6 | | SWATARA CREEK DR | 6 | | TWIN CREEKS DR | 6 | | |
|
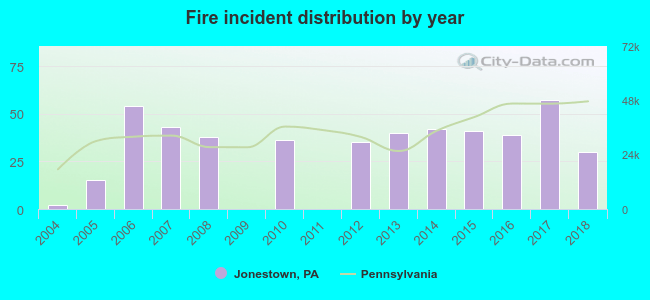 According to the data from the years 2004 - 2018 the average number of fires per year is 31. The highest number of fires - 57 took place in 2017, and the least - 0 in 2009. The data has an increasing trend.
 33.1% incidents where reported in the morning and 66.9% in the evening. The most fires (16.9%) took place on Monday, and the least (12.1%) on Tuesday.
 According to the 472 fire incidents from years 2004 - 2018 most fires (12.5%) took place during March, and the least (3.4%) in October.
 Out of all 998 cases reported during the years 2004 - 2018, the most belonged to the categories: Fire (47.3%), Overpressure Rupture (15.5%), and Rescue & EMS (12.5%).
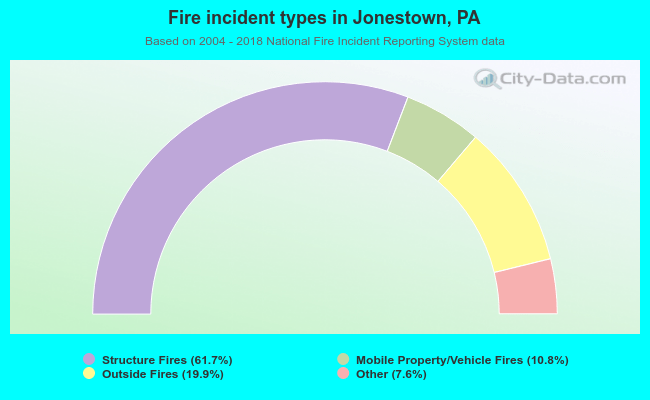 When looking into fire subcategories, the most reports belonged to: Structure Fires (61.7%), and Outside Fires (19.9%).