| Fire incidents reported |
|---|
| Sreet name | Count |
|---|
| MORGAN SCHOOL RD | 14 | | 127 SOUTH | 8 | | BERRYVILLE RD | 8 | | OLD CAPE ROAD | 8 | | STATE ROUTE 127 SOUTH | 8 | | 150 ELM DRIVE | 6 | | BERRYVILLE RD | 6 | | HEACOCK ST | 6 | | MAIN ST | 6 | | MARKET ST | 6 | | ROUTE 146 WEST | 6 | | SPRINGVILLE HILL RD | 6 | | STATE ROUTE 146 WEST | 6 | | WILLIFORD RD | 6 | | 127 NORTH | 4 | | 146 WEST HWY | 4 | | 45 ELM DRIVE | 4 | | 995 STATE ROUTE 127 SOUTH HWY | 4 | | AIRPORT RD | 4 | | ASHLER ST | 4 | | BROAD ST | 4 | | COOK AVE | 4 | | ELM DR | 4 | | FAIR CITY RD | 4 | | FOLLIS DR | 4 |
| | | Fire incidents reported |
|---|
| Sreet name | Count |
|---|
| HEACOCK | 4 | | LINGLE CREEK RD | 4 | | OLD CAPE RD | 4 | | ORANGE ST | 4 | | PARK LN | 4 | | PUBLIC SQUARE | 4 | | RHOADES LN | 4 | | RHODES LANE | 4 | | SOUTH MAIN | 4 | | SOUTH PECON | 4 | | WILLARDS FERRY ROAD | 4 | | 100 JASPER ST | 2 | | 1005 FAIR CITY ROAD | 2 | | 104 WEST MISSISSIPPI ST | 2 | | 1070 MORGAN SCHOOL ROAD | 2 | | 127 SOUTH RD | 2 | | 127SOUTH | 2 | | 1290 CLEAR CREEK LEVEE ROAD | 2 | | 1405 KRATZINGER RD. | 2 | | 1430 STATE HIGHWAY 127 SOUTH | 2 | | 150 FAIR CITY LANE | 2 | | 150 FOLLIS DRIVE | 2 | | 1580 MORGAN SCHOOL ROAD | 2 | | 201 PUBLIC SQUARE | 2 | | 201 SOUTH ORANGE ST | 2 |
|
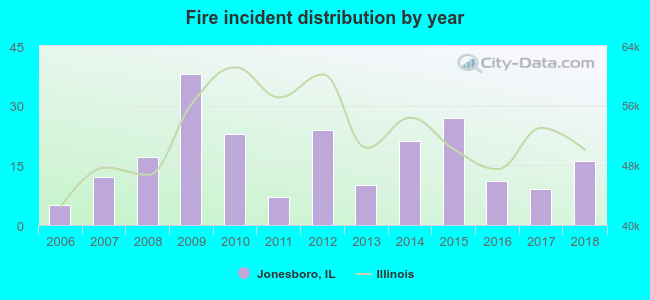 According to the data from the years 2006 - 2018 the average number of fires per year is 17. The highest number of reported fires - 38 took place in 2009, and the least - 5 in 2006. The data has an increasing trend.
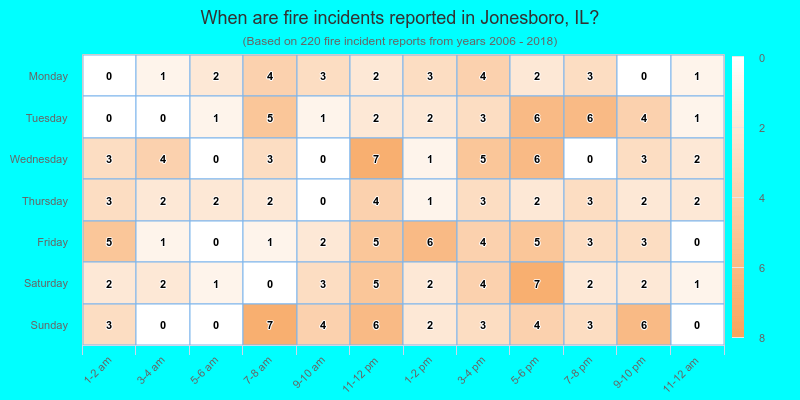
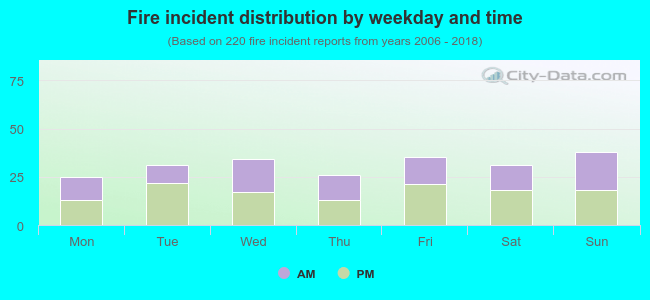 44.5% incidents where reported in the morning and 55.5% in the evening. The most fires (17.3%) took place on Sunday, and the least (11.4%) on Monday.
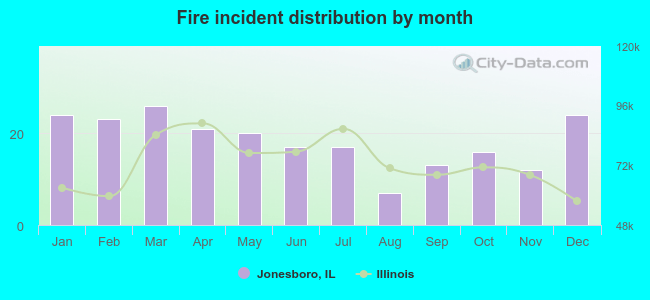 According to the 220 incident reports from years 2006 - 2018 most fires (11.8%) took place during March, and the least (3.2%) in August.
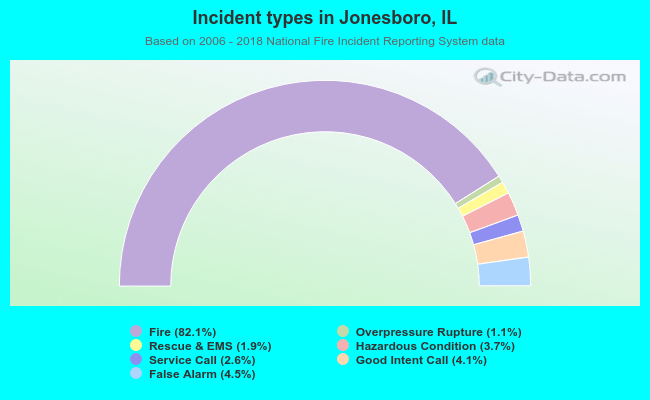 Out of all 268 cases reported during the years 2006 - 2018, the most belonged to the categories: Fire (82.1%), False Alarm (4.5%), and Good Intent Call (4.1%).
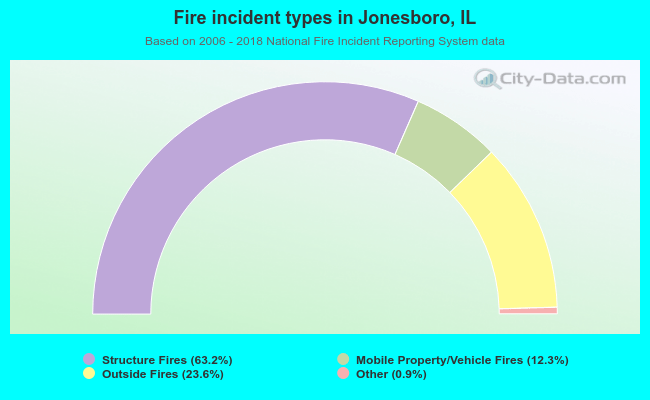 When looking into fire subcategories, the most reports belonged to: Structure Fires (63.2%), and Outside Fires (23.6%).