Jim Thorpe: Fire Incidents, Pennsylvania (PA)
Where are fire incidents reported in Jim Thorpe, PA
Something went wrong! Please refresh the page.
|
| |||||||||||||||||||||||||||||||||||||||||||||||||||||||||||||||||||||||||||||||||||||||||||||||||||||||||||||
2003 - 2018 National Fire Incident Reporting System (NFIRS) incidents
- Incident types reported to NFIRS in Jim Thorpe, PA
- 32632.0%Fire
- 21821.4%Rescue & EMS
- 21721.3%Hazardous Condition
- 14414.1%False Alarm
- 454.4%Service Call
- 444.3%Good Intent Call
- 171.7%Special Incident
- 70.7%Severe Weather
- Fire incident types reported to NFIRS in Jim Thorpe, PA
- 14644.8%Structure Fires
- 8827.0%Outside Fires
- 5115.6%Mobile Property/Vehicle Fires
- 4112.6%Other
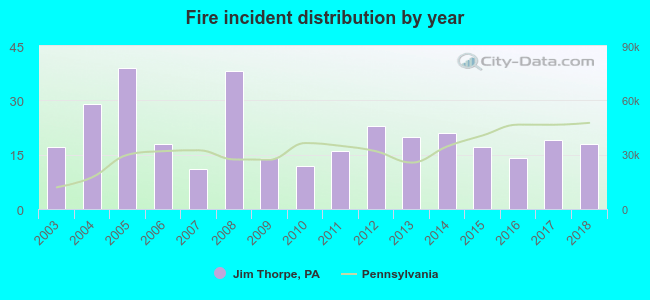 According to the data from the years 2003 - 2018 the average number of fire incidents per year is 20. The highest number of fire incidents - 39 took place in 2005, and the least - 11 in 2007. The data has an increasing trend.
 29.4% incidents where reported in the morning and 70.6% in the evening. The most fires (18.1%) took place on Sunday, and the least (9.8%) on Monday.
 Based on the 326 fire incident reports from years 2003 - 2018 most fires (13.5%) took place during April, and the least (3.4%) in October.
 Out of all 1,019 cases reported during the years 2003 - 2018, the most belonged to the categories: Fire (32.0%), Rescue & EMS (21.4%), and Hazardous Condition (21.3%).
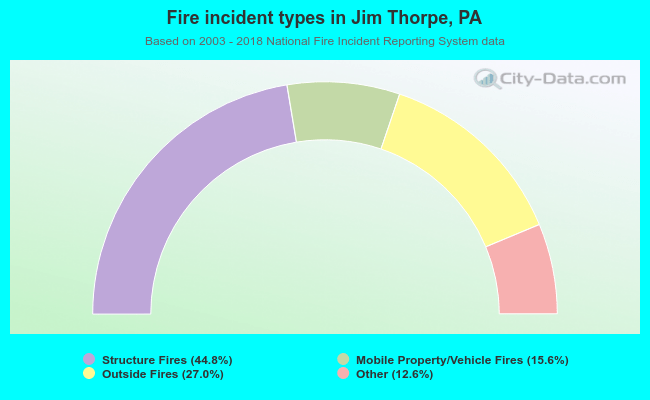 When looking into fire subcategories, the most reports belonged to: Structure Fires (44.8%), and Outside Fires (27.0%).