Jetmore: Fire Incidents, Kansas (KS)
Where are fire incidents reported in Jetmore, KS
Something went wrong! Please refresh the page.
|
| |||||||||||||||||||||||||||||||||||||||||||||||||||||||||||||||||||||||||||||||||||||||||||||||||||||||||||||
2005 - 2017 National Fire Incident Reporting System (NFIRS) incidents
- Incident types reported to NFIRS in Jetmore, KS
- 17169.5%Fire
- 4819.5%Rescue & EMS
- 135.3%Good Intent Call
- 93.7%Hazardous Condition
- 31.2%False Alarm
- 10.4%Overpressure Rupture
- 10.4%Service Call
- Fire incident types reported to NFIRS in Jetmore, KS
- 11265.5%Outside Fires
- 2615.2%Mobile Property/Vehicle Fires
- 1810.5%Structure Fires
- 158.8%Other
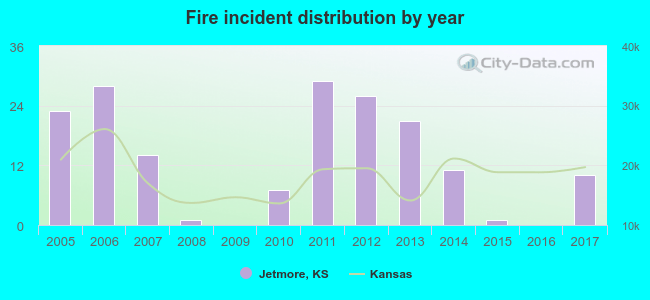 Based on the data from the years 2005 - 2017 the average number of fires per year is 13. The highest number of reported fires - 29 took place in 2011, and the least - 0 in 2009. The data has a dropping trend.
 23.4% incidents where reported in the morning and 76.6% in the evening. The most fires (22.2%) took place on Monday, and the least (7.0%) on Saturday.
 According to the 171 fire incident reports from years 2005 - 2017 most fires (18.1%) took place during June, and the least (1.8%) in September.
 Out of all 246 cases reported during the years 2005 - 2017, the most belonged to the categories: Fire (69.5%), Rescue & EMS (19.5%), and Good Intent Call (5.3%).
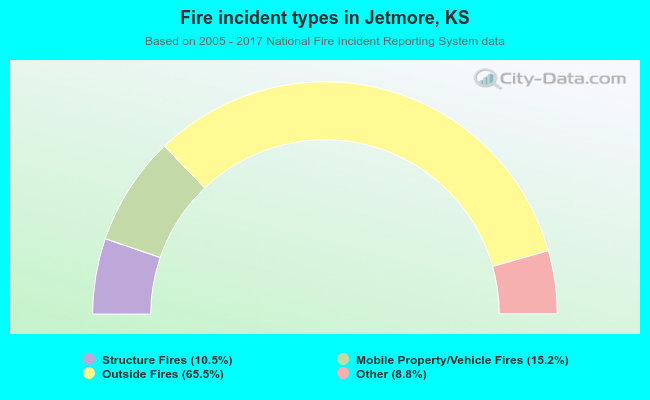 When looking into fire subcategories, the most reports belonged to: Outside Fires (65.5%), and Mobile Property/Vehicle Fires (15.2%).